
Fig. 4.
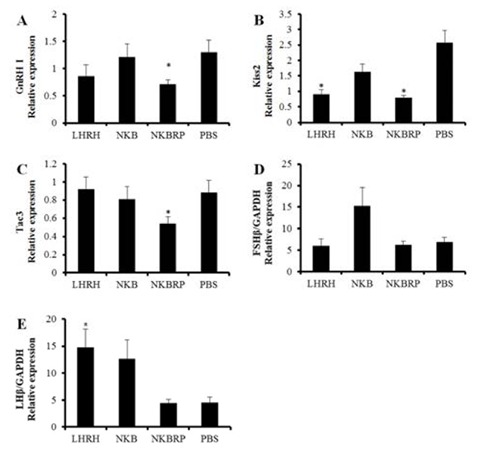
Expression levels of GnRH I (A), Kiss2 (B) andtac3 (C) mRNAs in the brains and FSHβ (D) and LHβ (E) mRNAs in the pituitaries of Nile tilapia injected either with LHRH, NKB, NKBRP or PBS. Relative abundance of the mRNAs in the brains was normalized to the amount of GAPDH and β-actin and in the pituitaries was normalized to the amount of GAPDH by the comparative threshold cycle method using qRT-PCR. Results are means ± SEM (n=6–8). * indicates significant difference from PBS group (P<0.05).