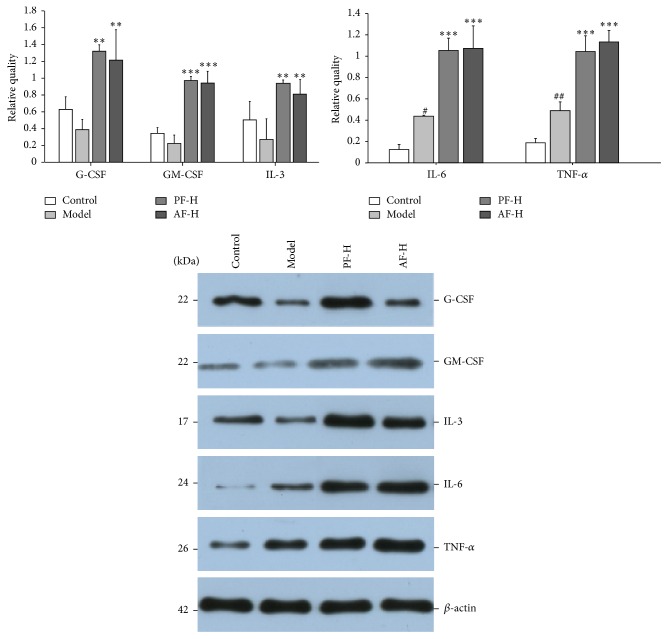
Figure 5.
Effects of PF and AF on GM-CSF, G-CSF, IL-3, IL-6, and TNF-α protein levels. Control = negative control (with same volume of physiologic saline). Data are expressed as means ± SD (n = 3). Compared with the control group: # P < 0.05 and ## P < 0.01; compared with the model group: ∗∗ P < 0.01 and ∗∗∗ P < 0.001.

