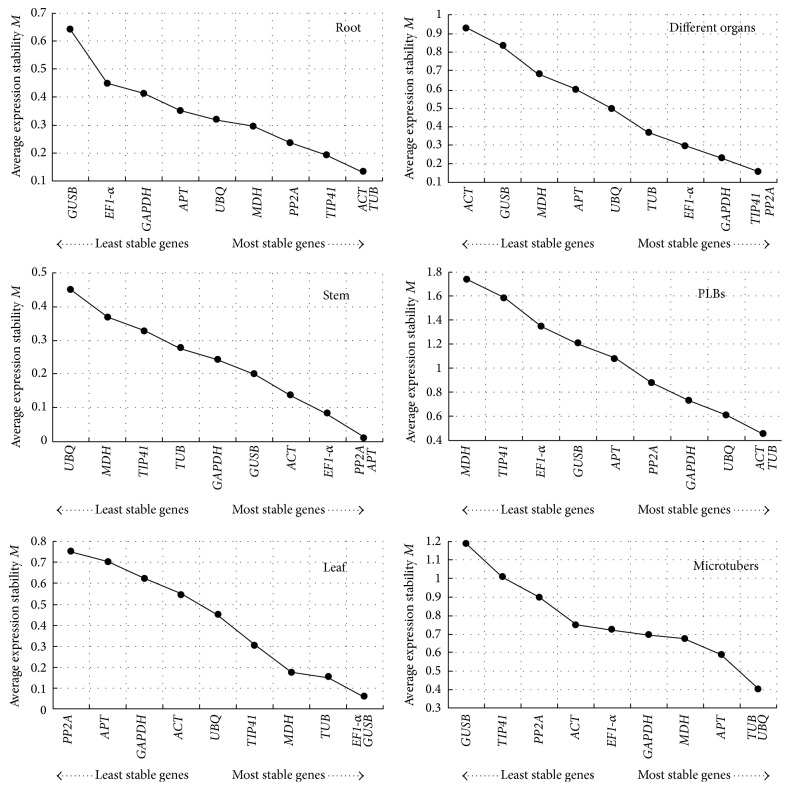
Figure 3.
Gene expression stability and rankings of ten candidate reference genes, as calculated by geNorm software. The average expression stability (M) was calculated following stepwise exclusion of the least stable gene across all the samples within an experimental set. The lowest M value indicates the most stable gene, while the highest value represents the most highly variable gene.

