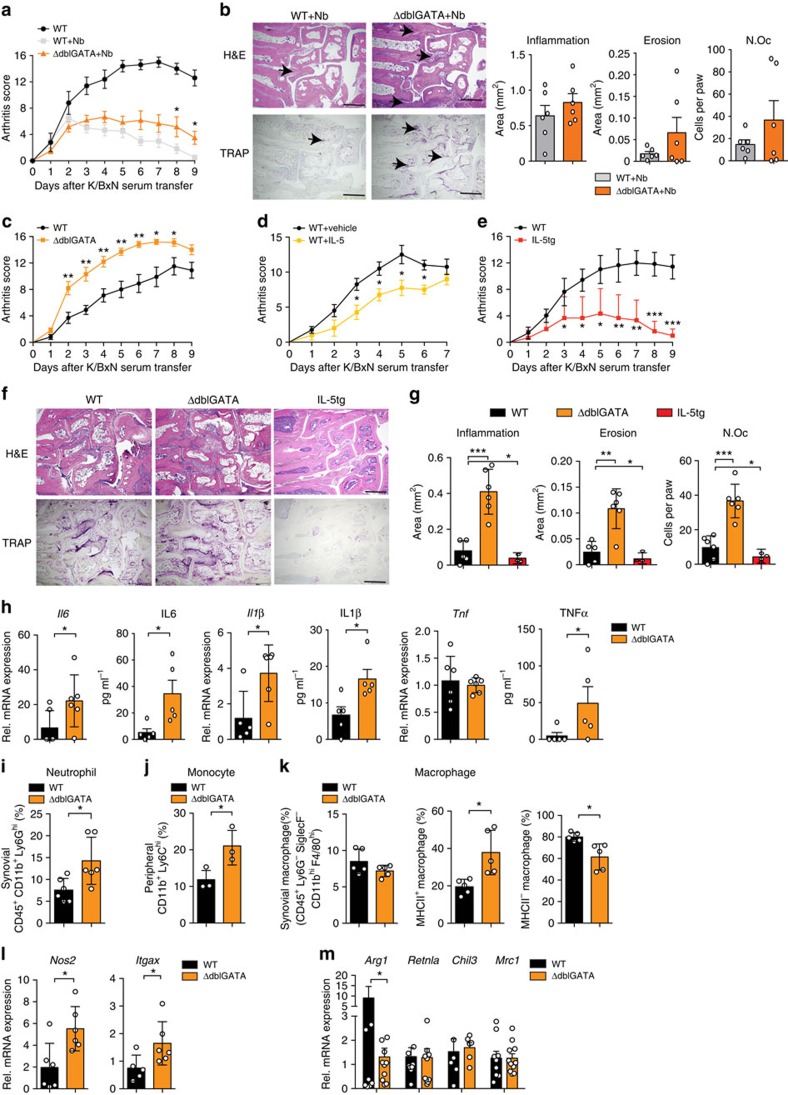
Figure 5. Eosinophil numbers control resolution of arthritis.
(a) Arthritis score in WT unchallenged and N. brasiliensis (Nb) challenged WT mice and eosinophil-deficient ΔdblGATA mice induced for K/BxN serum transfer arthritis (n=6 per group). (b) Haematoxylin/eosin (H&E) and tartrate-resistant acid phosphatase (TRAP) staining and quantification of inflammation area, erosion area and number of osteoclasts (Oc.N) per paw 9 days after serum transfer (n=6 per group); scale bar, 500 μm. (c) Arthritis score in WT and ΔdblGATA mice after K/BxN serum transfer (n=6 per group). (d) Arthritis scores in WT mice injected with vehicle or recombinant IL-5 during serum transfer (n=4 per group). (e) Arthritis scores in WT and IL-5tg mice after serum transfer (n=6 per group). (f) H&E and TRAP staining and (g) quantification of inflammation area, erosion area and N.Oc per paw 9 days after serum transfer (n=6 per group); scale bar, 500 μm. (h) Analyses of Il6, Il1β and Tnfα mRNA expression in synovial extracts and IL6, IL1β and TNFα serum level of WT and ΔdblGATA mice 9 days after serum transfer (n=6 per group). (i) Percentage of CD45+CD11b+Ly6Ghi neutrophils in the joints of arthritic WT and ΔdblGATA mice (n=5 per group). (j) Percentage of peripheral CD11b+Ly6Chi monocytes in arthritic WT and ΔdblGATA mice (n=3 per group). All analyses above were performed 9 days after serum transfer. (k) Percentage of total macrophages (CD45+Ly6G−SiglecF−CD11bhiF4/80hi cells), MHC II+ macrophages and MHC II− macrophages in the joints of WT and ΔdblGATA mice 9 day after serum transfer (n=5 per group). (l) Quantitative reverse transcriptase–PCR (RT–PCR) analyses of Nos2 and Itgax expression in joint extracts of WT and ΔdblGATA arthritic mice (n=6 per group). (m) Quantitative RT–PCR analyses of Arg1, Retnla, Chil3 and Mrc1 expression in joint extracts of WT and ΔdblGATA mice 9 days after serum transfer (n=6–11 per group). Data are expressed as mean±s.e.m. Pictures are representative of 3 independent experiments. Asterisks mark statistically significant difference (*P<0.05, **P<0.01 and ***P<0.001 determined by Student's t-test for single comparison).

