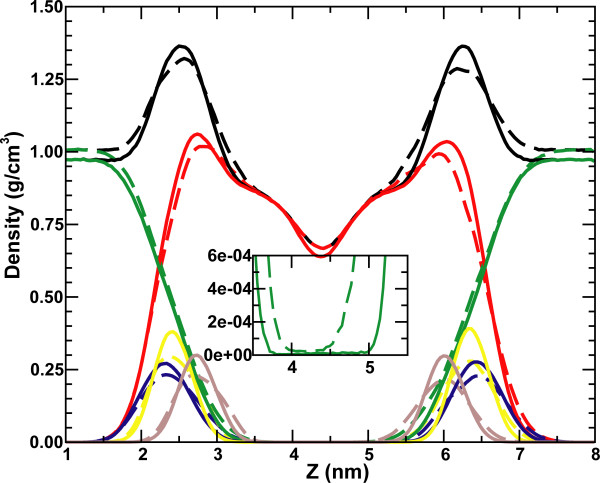
Figure 6.
Density profile, comparing the distribution of water, lipids, and elements of the lipid head groups in a simulation without external field (solid lines, averaged over 0–20 ns) and with an external field of 0.33 V/nm (dashed lines, averaged over 20–50 ns). Black is the total density, green water density, red lipid density, yellow phosphate density, blue choline density, and brown glycerol density.

