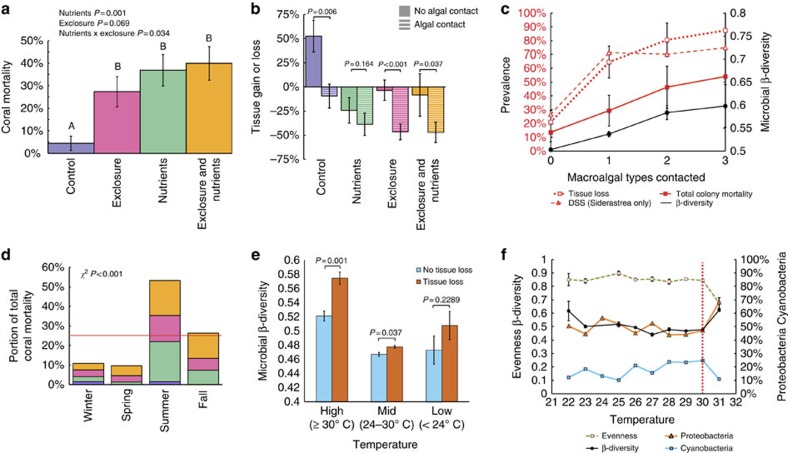
Figure 3. Multiple stressors disrupt coral microbial communities and produce coral mortality.
(a) Cumulative coral mortality at end of experiment. P values are from mixed effect models, letters over bars show differences in Tukey's post hoc tests. Herbivore removal significantly increased coral mortality relative to controls (Tukey's post hoc test P<0.05), but not relative to nutrient pollution alone (post hoc test and mixed effects model P>0.05). (b) Effects of algal contact on coral tissue area, across treatments. P values from ANOVAs test the effect of algal contact within each treatment. (c) Number of algal taxa contacting corals versus microbiome β-diversity (weighted UniFrac distance), and the prevalence of coral tissue loss, mortality and Siderastrea dark spot syndrome (DSS). (d) Seasonal distribution of coral mortality, coloured by treatment (a). Red line marks null expectation of equal mortality across seasons. P value is from a χ2-test. (e) Microbial community β-diversity for corals with or without tissue loss, split by temperature. P values reflect non-parametric t-tests of distances. (f) Temperature effects on coral microbial variability, evenness and relative abundance of Proteobacteria or Cyanobacteria. Evenness and β-diversity data are means±s.e.m. Microbial and coral health data are averaged within each 1 °C interval on the x axis. The vertical red line at 30 °C indicates the point nearest to the MMM +1 °C value for our site (30.26 °C); temperatures beyond this result in accumulation of degree heating weeks of coral thermal stress (Methods).

