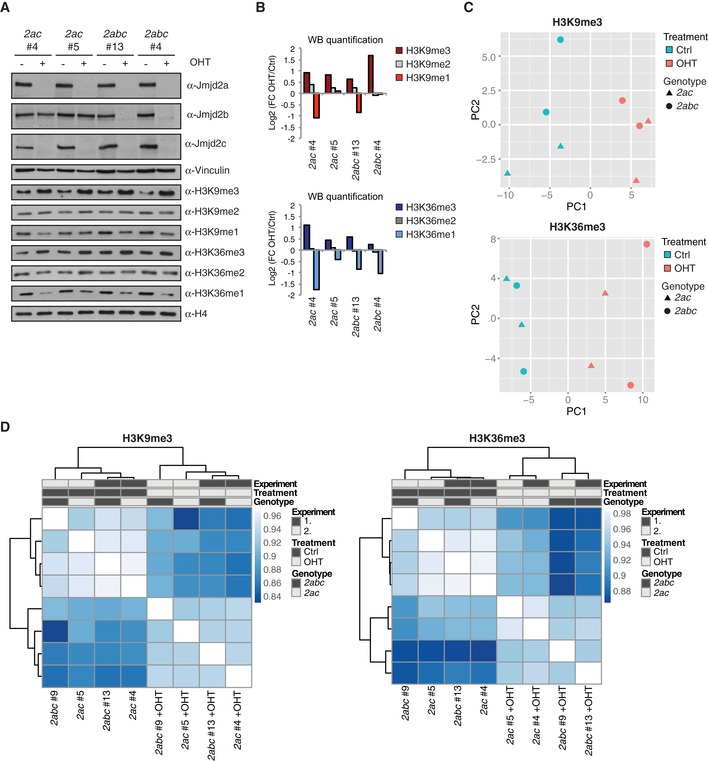
Figure EV2. 2ac and 2abc KO ESCs show reproducible and comparable changes in H3K9me3 and H3K36me3 patterns.

-
AWB analyses of 2ac and 2abc ESC lines. Results are representative of at least three independent experiments.
-
BQuantification of the histone modification WB presented in (A). Each membrane was reprobed with an antibody detecting H4 for normalization. Data are presented as log2 fold change (OHT versus control treated).
-
C, DResults of (C) principal component analyses and (D) Pearson's correlation coefficient analyses of H3K9me3 and H3K36me3 read counts across all TSS regions (± 1 kb). ChIP‐seq data were generated in two different experiments involving a total of four independently derived ESC lines cultured in the absence or presence of OHT.
