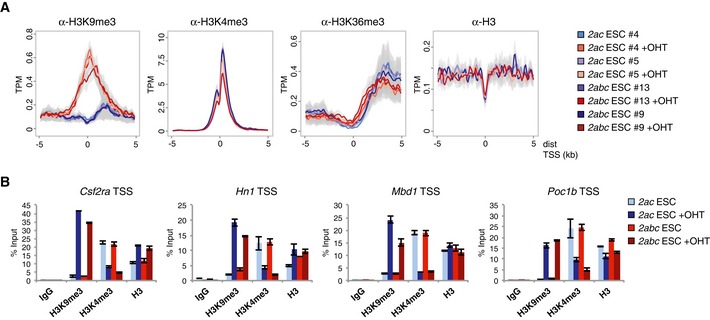
Figure EV4. TSS regions with substantial gain of H3K9me3 show reduced levels of H3K4me3.

- Density plots are presented for the 100 Jmjd2a/c bound TSSs showing the greatest increase in average H3K9me3 levels. Fold change in H3K9me3 read counts was calculated for each ESC line (OHT versus Ctrl) for regions of ± 1 kb of TSSs. Plots show average ChIP‐seq signals with 95% confidence intervals of the mean.
- Independent ChIP‐qPCR validations. Note that the target genes show impaired expression upon loss of Jmjd2a/c expression. Graphs show mean ± SD for three technical replicates and are representative of results obtained in at least two independent experiments.
