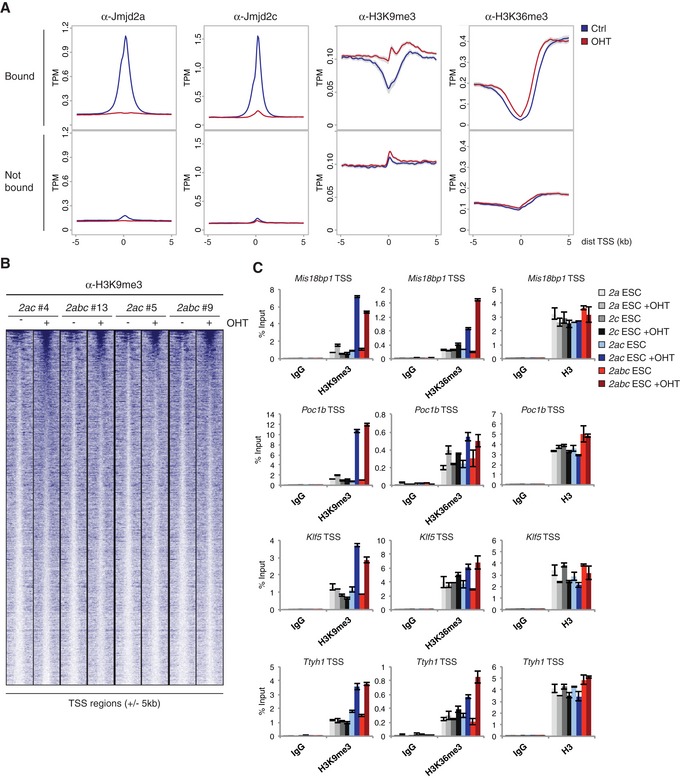
Figure 5. Jmjd2a and Jmjd2c redundantly regulate histone methylation levels.

- Density plots showing average ChIP‐seq signals with 95% confidence intervals of the mean indicated in grey. Y‐axes show mean tags per million (TPM). Data were obtained using the 2ac ESC line #4. TSSs were classified as “Bound” if containing binding sites for both Jmjd2a and Jmjd2c within ± 1 kb (see Fig 4F), or “Not bound” if neither protein binds within the same region.
- Heat map showing H3K9me3 ChIP‐seq data for Jmjd2a/c bound TSSs (± 5 kb) sorted according to read number in 2abc #13+OHT.
- ChIP‐qPCR validations for selected Jmjd2a/c targets (see Fig 4G). Graphs show mean ± SD for technical triplicates and are representative of results obtained in at least two independent experiments.
