Figure 3.
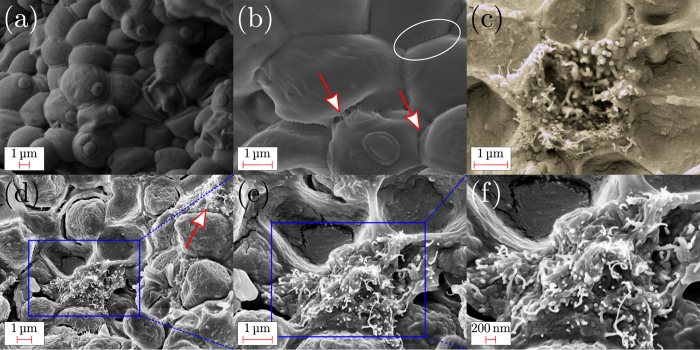
(a) FESEM image of Saccharomyces cerevisiae. (b) FESEM image showing CNTs bridging yeast cells. The arrows indicate the CNTs bridging the yeast cells. Encircled the interface at which the CNTs volume fraction f was estimated. (c) FESEM image of the cross section of the fermented yeast/CNTs film after prolonged exposure to FESEM where CNTs protruding from a broken yeast cell are visible. (d–f) FESEM images of the yeast/CNTs film without fermentation taken at different magnifications. The arrow indicates the CNT bundle while the square identifies the magnified region.

