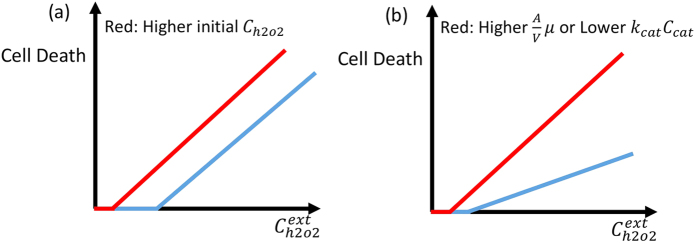
Figure 1. Schematic view of cell death as a function of extracellular concentration of H2O2.
(a) In this plot cell permeability and catalase activity are the same for blue and red curves, but the intrinsic concentration of intracellular H2O2 is higher for the blue curve. (b) In this plot cell permeability is lower or catalase activity is higher for blue curve as compared to the red curve and the initial concentration of H2O2 is a bit more for the blue curve. The difference in catalase activity or cell permeability changes the slope of cell death as a function of the external concentration of H2O2.

