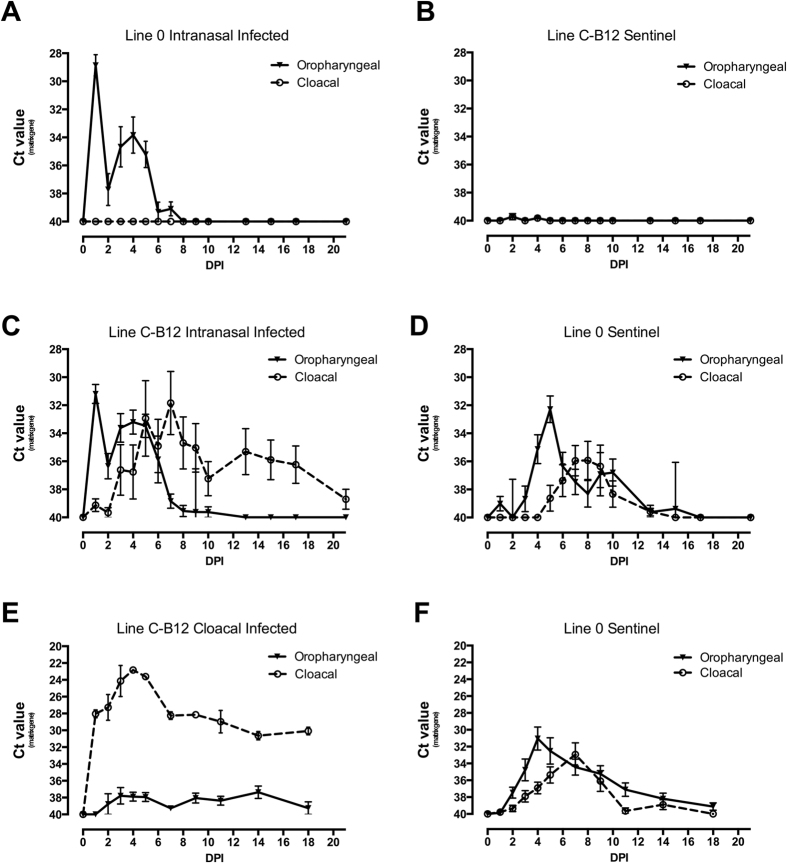
Figure 2. Viral shedding trajectories of sentinel birds that were in contact with birds of a different line infected with LPAI virus.
Viral shedding was measured, following infection with H7N7 inoculation, in oropharyngeal (continuous line) and cloacal swabs (dashed line) of both directly-infected and contact sentinel birds. Two sets of 10 birds of each line (line C-B12 and Line 0 birds) were housed together in isolators. In the first experiment, in one isolator, only Line 0 birds were infected by the nasal route (shedding represented in (A)); viral shedding was analysed from contact C-B12 birds (B). In the other isolator, only C-B12 birds were infected (shedding represented in (C)) and viral shedding analysed from contact Line 0 birds (D). In a further experiment, 2 set of 10 birds, one of each line, were caged together and only line C-B12 birds infected by the cloacal passage ((E): shedding C-B12; (F) shedding Line 0). Results represent mean ± S.E.M of Ct (cycle threshold) value obtained by qRT-PCR of influenza matrix gene. All birds are included at each time point, irrespective of shedding status.

