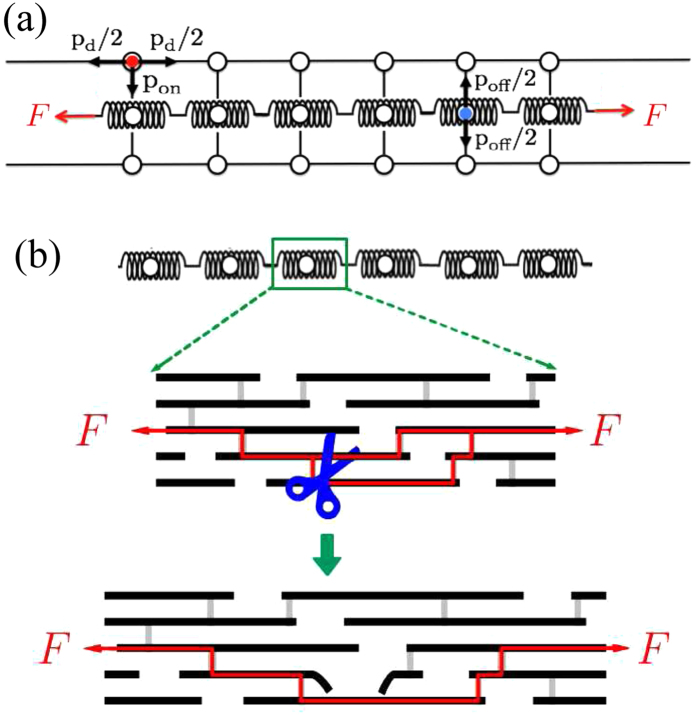
Figure 1. Schematic diagram of the computational model used in the simulations.
(a) The chain of springs and binding sites are represented by small open circles. The two layers of sites surrounding the fiber are represented by the big open circles and the two types of particles are shown as filled circles with the red and blue circles corresponding to the degradative and regenerative particles, respectively. A particle at the bottom, can move up, left or right whereas a particle at the top can move down, left, or right. When a particle binds to a spring, it can stay there or move up or down. The ends of the chain are submitted to a constant force F during the entire simulation. A periodic boundary condition was applied along the x direction. (b) A zoom into one of the springs representing collagen monomers in parallel (black) reinforced by cross-links (gray). Red shows the force transmission pathways and the blue scissors represent a bound enzyme to a collagen monomer (middle diagram). Once the enzyme unbinds, the monomer is cleaved, but part of the monomer still participates in force transmission (bottom diagram).

