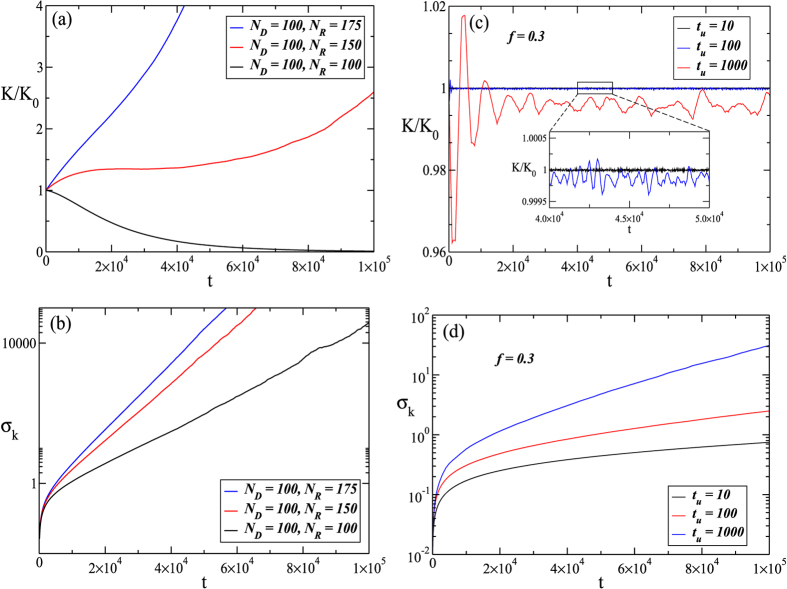
Figure 2. The normalized fiber stiffness and the standard deviation as a function of time.
(a) The normalized stiffness K/K0, where K0 is the fiber stiffness at t = 0, as a function of time when no regulation is applied. The number of D and R particles are indicated by ND and NR. (b) The standard deviation σk of the local spring constants k as a function of time when there is no regulation. In panels (c,d), we show the normalized stiffness and the standard deviation as a function of time for the TCM model. In both cases, colors indicate different time periods tu at which the particles are updated to replace a fraction of them with new ones. The inset shows a close-up of the fiber stiffness for tu = 10 and 100. The parameters used in the simulations were: Ns = 103; γ = 0.995, poff = 0.5. These results were obtained from an average of 500 simulations.

