
Figure 4.
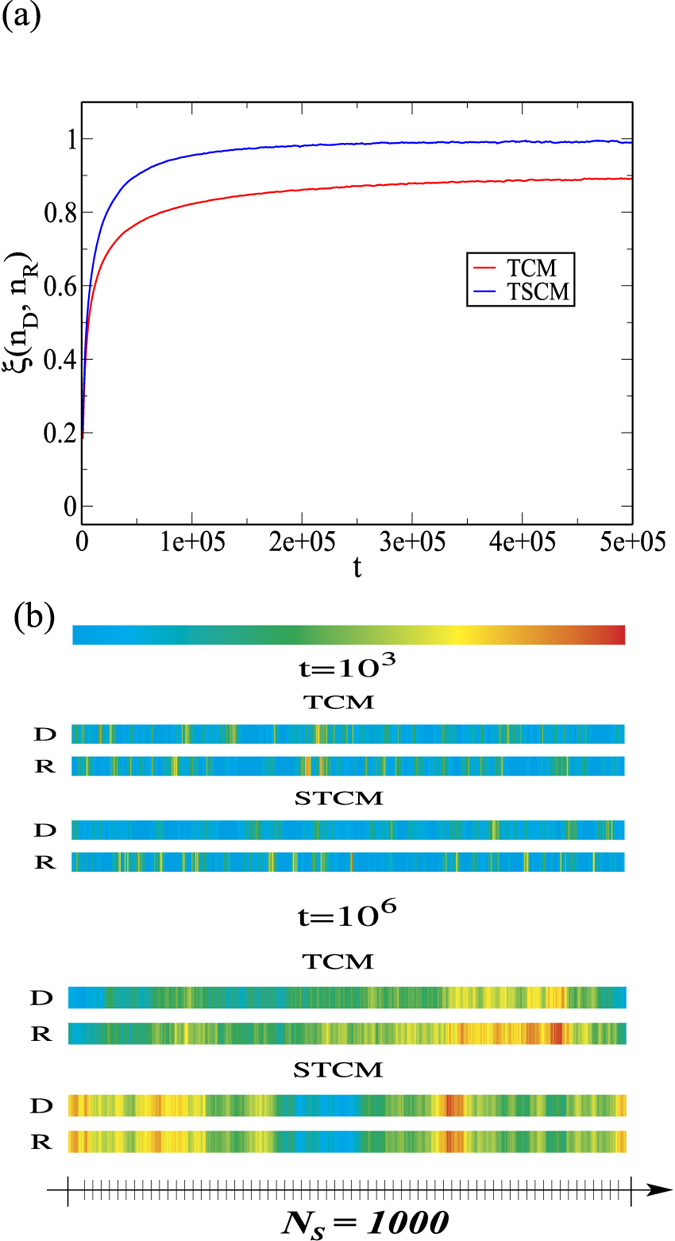
Panel (a) shows the correlation function ξ(nD, nR) between the number of visits of D and R particles as a function of time for the models studied, TCM and STCM. The correlation function is obtained by computing the correlation coefficient between two corresponding data series, the number of D visits along the chain and the number of R visits along the chain. Panel (b) presents color maps of the average number of visits, nD and nR, to every spring along the chain at two time points for the TCM and STCM models. Blue and red represent low and high number of visits, respectively. The number of visits is normalized by the maximum number of visits at each time point. For the shorter diffusion time of t = 103, the color maps for D and R particle visits are quite different for both models. For the longer time scale of t = 106, the color maps for the TCM remain different but the STCM displays perfectly matched color maps. This means that at each location, the number of visits of the two types of particle is the same balancing local digestion and repair. These results are in agreement with the correlation function that approaches 1 only for the STCM. These results were obtained from an average of 500 simulations.