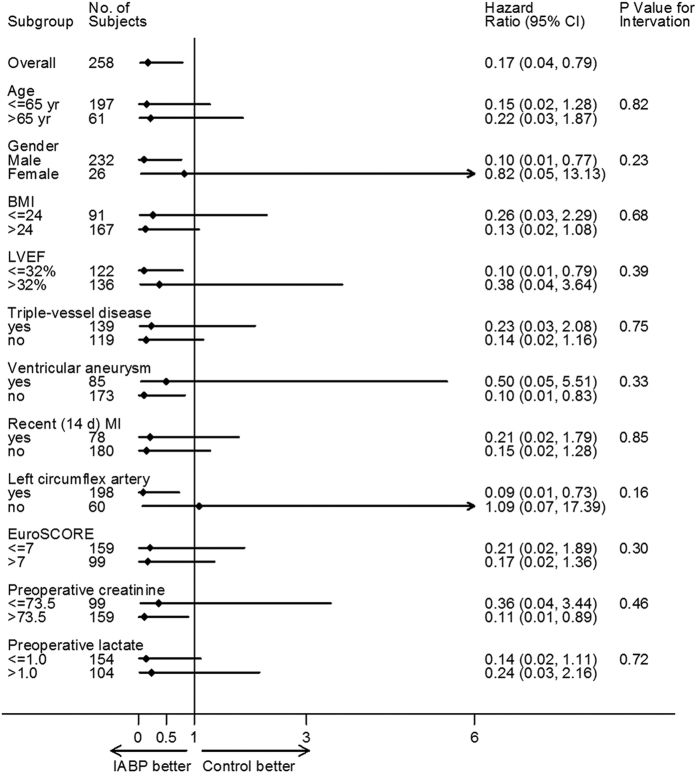
Figure 4. Subgroup analysis for 30-day mortality after surgery.
Subgroup analyses are shown for 30-day mortality between patients with preoperative IABP vs. controls. The p-value for interaction represents the likelihood of interaction between the variable and the relative treatment effect. BMI denotes body mass index, LV denotes left ventricular, NYHA denotes New York Heart Association, and EuroSCORE denotes European System for Cardiac Operative Risk Evaluation.

