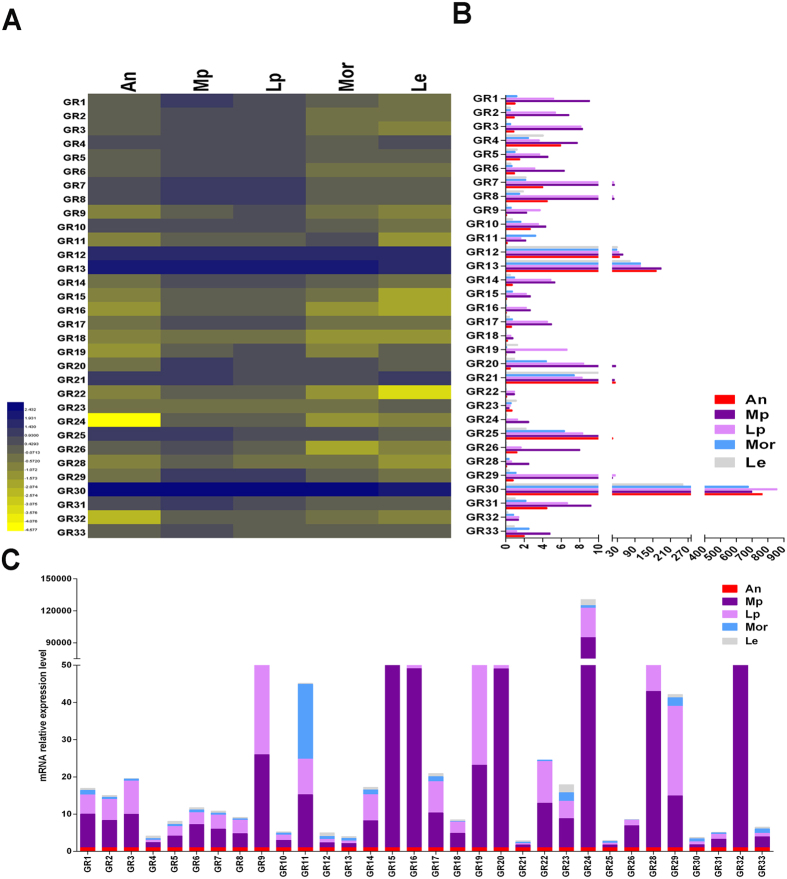
Figure 4. Tissue expression profile of PameGR genes based on relative mRNA quantity.
(A) Heat map illustrating the Log10 transformation of mRNA expression levels of the PameGRs in different tissues. (B) Relative mRNA expression level of all the PameGR genes; the level of expression of PameGR1 in the antennae was set as 1. (C) Relative mRNA expression level of each PameGR gene in a represented stack; the level of expression of PameGR in the antennae was set as 1. An, antennae, Mp, maxillary palps, Lp, labial palps Mor, mouthparts without Mp and Lp, Le, Legs.

