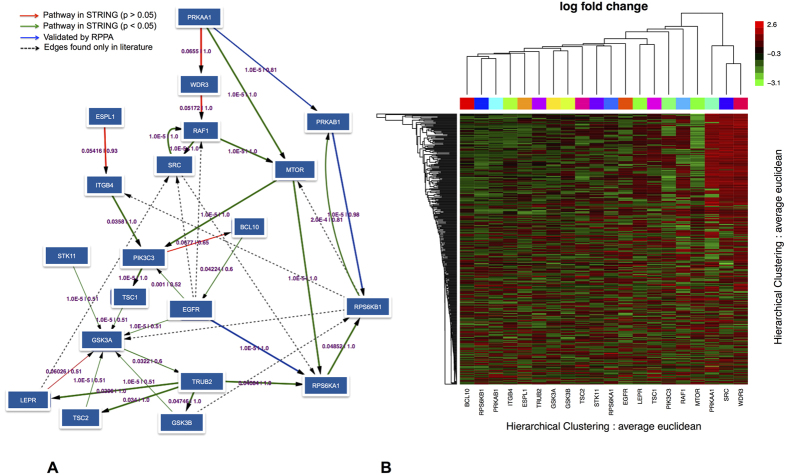
Figure 1.
(A) High confidence edges (50% probability cutoff) showing the interplay between PRKAA1/PRKAB1 and EGFR dependent signaling. Edges indicate upstream/downstream relations. They may not correspond to direct, physical protein interactions. Edge thickness is drawn according to the level of edge confidence. Edge labels indicate the p-value according to the comparison with the STRING22 database (first number) as well as the level of edge stability (from 0 to 1, second number). Green edges indicate a nominell significant (p < 0.05) overlap with pathways from STRING (using only edges with confidence >0.5), while red ones do not. Blue edges are validated by protein expression data. Dashed black edges can only be found as protein-protein interaction in STRING, but are not present in our network. An additional complete validation of our network with protein-protein interactions from the HIPPIE database23 can be found in Figure 5 of supplemental file S2. (B) The heatmap shows the perturbation effects for individual gene silencings: rows = effects observed, columns = genes perturbed. The colors depicts log fold change for corresponding perturbations (green = down-regulation, red = up-regulation).

