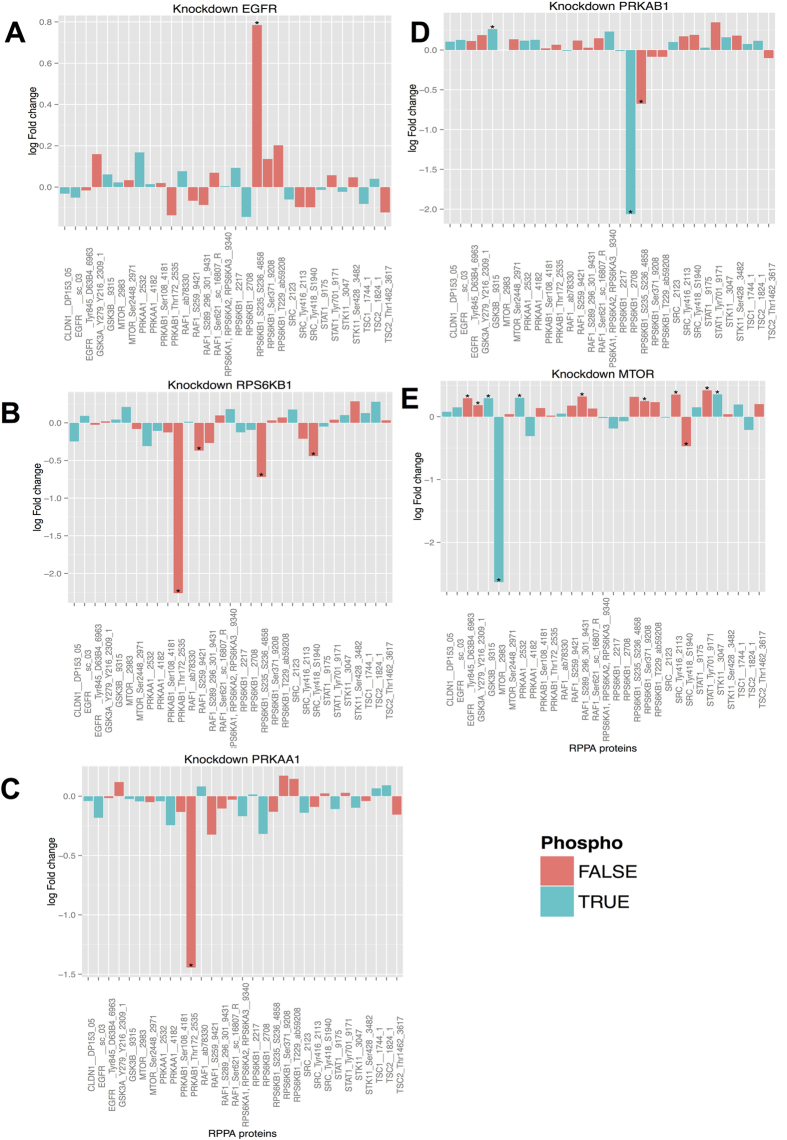
Figure 2. Protein log fold changes after different knockdowns.
The RPPA technique is antibody based, and thus for one and the same protein different identifiers can appear on the x-axis. The employed antibody is indicated as part of the protein name. Bar colors indicate total (red) or phospho-protein (blue) concentration changes. A star (*) indicates a statistically significant result (FDR < 5%). Effects are given for knockdown of: EGFR (A), RPS6KB (B), PRKAA1 (C), PRKAB1 (D) and mTOR (E).

