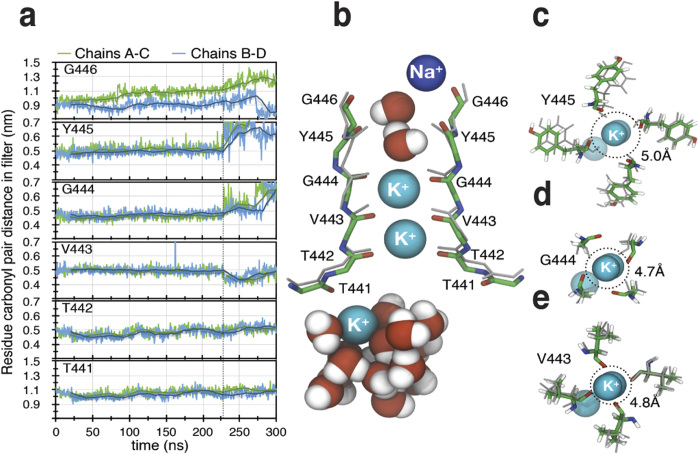
Figure 4. Molecular modelling of the mechanism for C-type inactivation.
(a) Distances between the α carbons for six residues in the selectivity filter during a 300 ns long MD simulation when all four 416 residues are pulled away from the center of the channel at a rate of 0.001 nm/ns (see Methods for details). After 229 ns (vertical line) the distances are abruptly altered and the first K+ leaves the filter array. (b) A snapshot at the time of the filter collapse (229 ns) shows that the array of K+ in the selectivity filter retreat downwards. Water and Na+ interact with carbonyls (red sticks) in positions 445 and 446. Structure is aligned to initial frame of the simulation (grey sticks) with regard to N, CA, C, and O backbone atoms in position 441 to 446 of all four chains. (c–e) Filter distortion (top view). At positions 445 (c) and 444 (d) there is an increase in filter diameter (average of distances between carbonyls of opposing chains) compared to initial structure (grey sticks, dotted circle). At position 443 (e) there is a decrease in filter diameter. There is also side chain rotations of Y445 at the moment of filter collapse (c).

