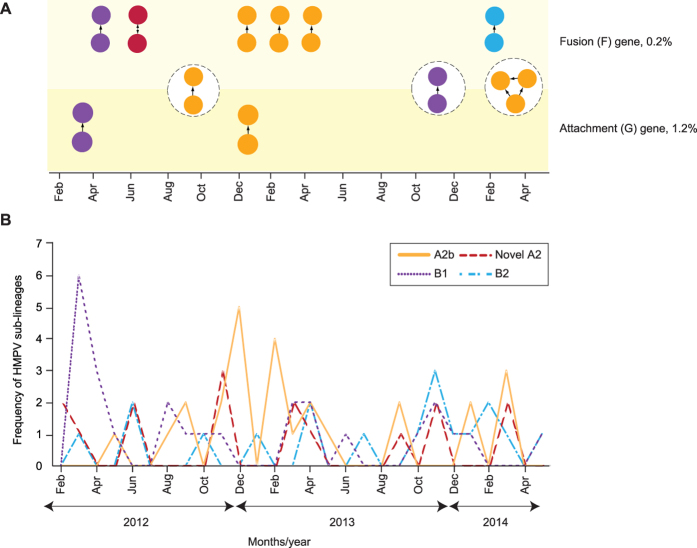
Figure 4. Human metapneumovirus (HMPV) transmission network among the adults and children in Kuala Lumpur between February 2012 and May 2014.
The transmission network was inferred from the newly-sequenced F (n = 85) and G (n = 82) genes based on the Tamura-Nei 93 (TN93) pairwise distance estimates51 performed using a custom script in Python (release 3.2.6) with 1,000 bootstrap replicates. (A) The monthly distribution of transmission clusters inferred for F and G genes at the genetic distance cutoffs of 0.2% and 1.2%, respectively. The three common transmission clusters identified in both genes were highlighted in circles (dotted lines). Probable direction of disease transmission within a cluster was estimated by placing a directed edge from the putative “donor” node to the “recipient” node(s), where the estimated date of infection, EDIdonor is older than the EDIrecipient18. (B) The monthly frequency (in absolute numbers of samples/individuals) of HMPV sub-lineages co-circulating in the study population. HMPV sub-lineages A2b, B1, B2, and the novel sub-lineage of A2 were indicated by their respective colours.

