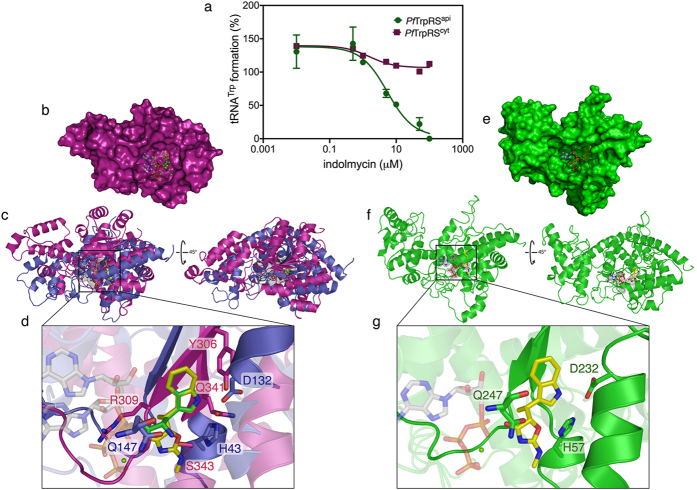
Figure 5. Selective inhibition of Pf TrpRSapi but not Pf TrpRScyt by indolmycin.
(a) Inhibition of tRNAtrp formation by Pf TrpRSapi (shown in green) and Pf TrpRScyt (shown in red) was tested at increasing concentrations of indolmycin. Pf TrpRSapi is completely inhibited at higher concentrations, Pf TrpRScyt is comparatively insensitive. (b) Surface representation of chain A of the crystal structure of P. falciparum cytosolic TrpRS with bound 5′AMP•tryptophan-indolmycin overlay (PDB: 4J75; shown in magenta) and (c) cartoon representations of the protein superimposed with chain A of the crystal structure of B. stearothermophilus TrpRS with bound ATP•Mg2+•indolmycin (PDB: 5DK4; shown in violet). (d) Zoom-in view of ATP•Mg2+•indolmycin-tryptophan overlay in the catalytic core of TrpRS. Surface (e) and cartoon (f ) representations of P. falciparum apicoplast TrpRS with bound ATP•Mg2+•indolmycin. Note that the iTasser C-score for this model is low (−2.5), indicating global model low quality, although manual inspection indicates a good structural fit in the tryptophan binding region. (g) Zoom-in view of ATP•Mg2+•indolmycin in the conserved catalytic core of TrpRS. A number of residues within the active site were made transparent to show the ligand and relevant interacting residues. The substrates are shown as sticks. ATP substrates are shown in white, tryptophan is shown in green, and indolmycin is shown in yellow.

