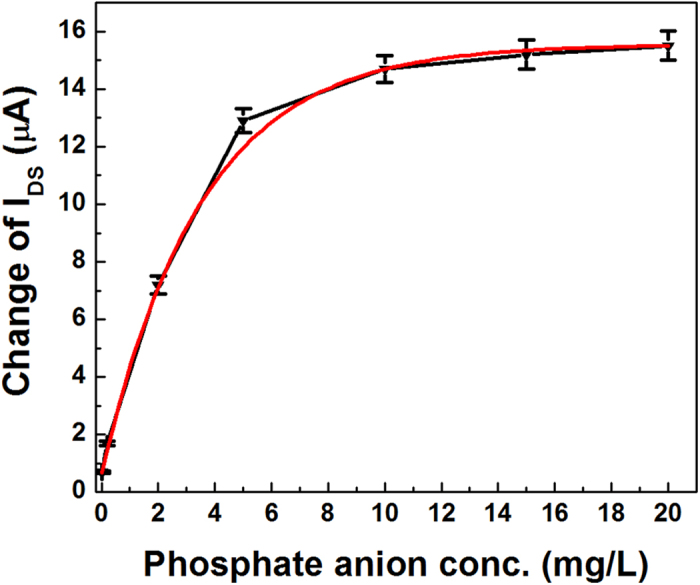
Figure 5. The current change versus the phosphate concentration at constant bias of 0.5 V.

The data points and error bars represent the average value and the standard deviation, respectively, and each measurement was repeated at least six times.

The data points and error bars represent the average value and the standard deviation, respectively, and each measurement was repeated at least six times.