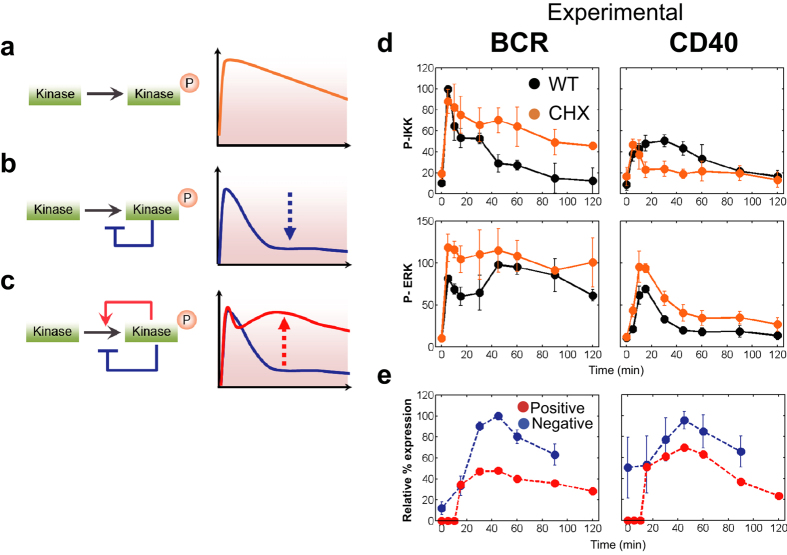
Figure 4. Assessment of transcriptional feedback regulation.
(a–c) Scheme of feedback effects on kinase activity. Kinase activity without feedback (orange line) (a); kinase activity without positive feedback (blue line); hypothetical effect of negative feedback (blue dotted arrow) (b); kinase activity with positive and negative feedback (red line); hypothetical effect of positive feedback (red dotted arrow) (c). (d) The black dots represent the data of IKK or ERK activities in BCR or CD40-stimulated cells as shown in Fig. 1. The quantified activities of IKK and ERK in CHX pre-treated cells are represented as orange dots (+CHX). The activities were analysed by immuno blotting (Supplementary Fig. S3) as in Fig. 1. The data shown represent the means ± s.d. (n = 2). (e) Red circles depict the rate of newly synthesized IAP (Positive) relative protein amounts that were analysed by immuno blotting and calculated as described in Supplementary Fig. S4. The data shown represent the means ± s.d. (n = 2). The blue circle (Negative) indicates the averaged gene expression kinetics of A20 for BCR-signalling and of DUSP5 and SPRY2 for CD40-signaling, respectively as displayed in Fig. 3. The values shown indicate values relative to the maximum for each gene expression. The dotted line represents the fitted curve as described in Methods.

