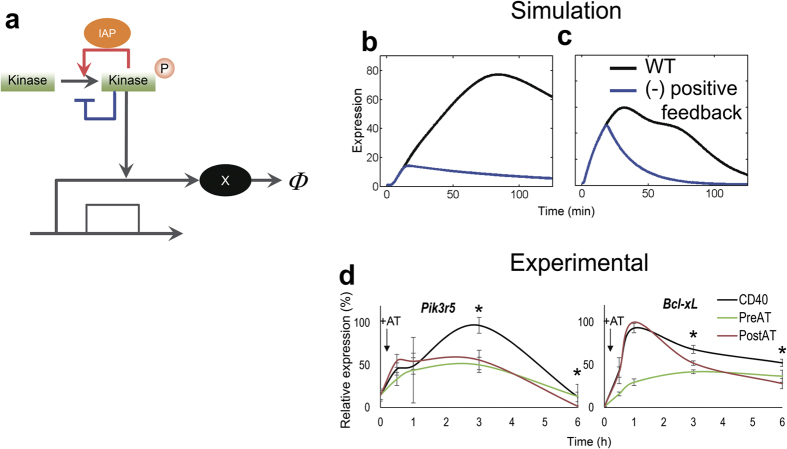
Figure 6. Evaluation of feedback effects on gene expression.
(a) Schematic illustration of the simple transcriptional motif. (b) IKK activity-associated gene expression in CD40 stimulated cells. (c) ERK activity-associated gene expression in CD40 stimulated cells. The IKK activity and ERK activity of kinase in model (B) (a) were employed using the kinase activities of model (A) in Fig. 5b. (d) Quantitative analysis of gene expression examined by quantitative reverse transcriptional polymerase chain reaction. Cells were stimulated by anti-CD40 alone (CD40, black line), anti-CD40 pretreated with IAP inhibitor (PreAT, green line), and anti-CD40 plus IAP inhibitor added 10 min (+AT, allow) after stimulation (PostAT, red line). The data are represented as the means ± s.d. (n = 2). *P < 0.001, CD40 versus PostAT.

