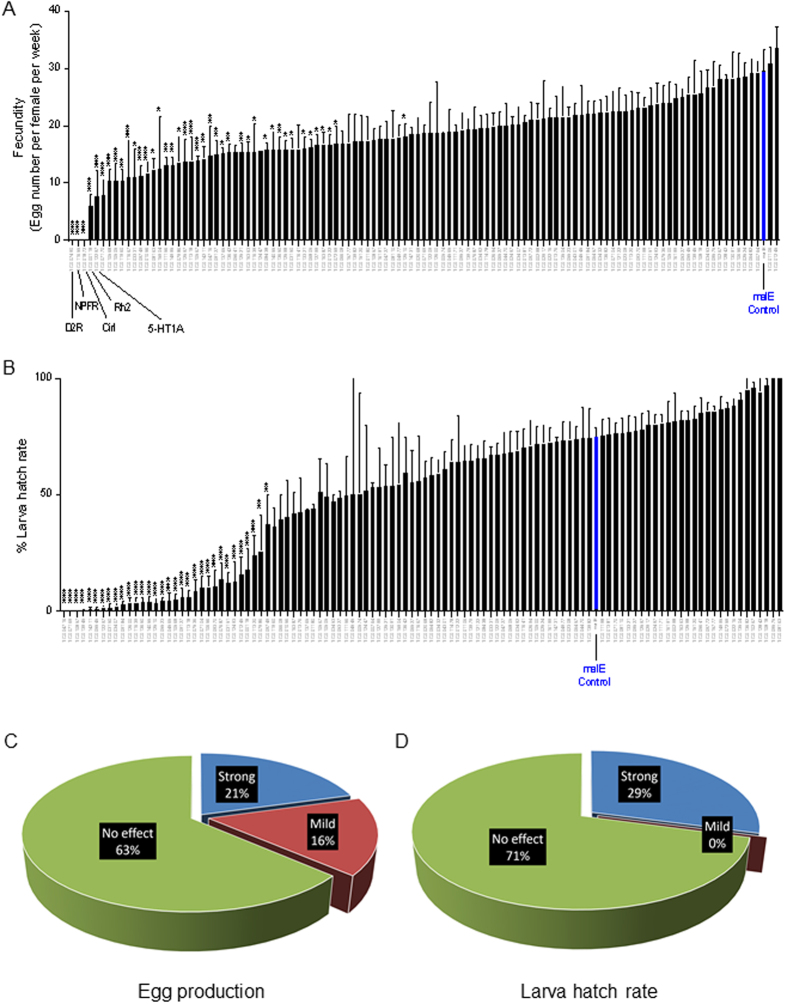
Figure 1. RNAi screen identified GPCRs involved in female fecundity and larva hatch rate in T. castaneum.
(A) Fecundity of females injected with dsRNAs targeting 112 GPCRs and malE control. Fecundity is presented as egg number per female per week. (B) Larval hatch rate from eggs laid by RNAi females. Hatch rate is calculated as the percentage of the number of hatched larvae versus the total number of the eggs laid. Each bar represents mean ± SE of 4~10 cohorts, 12~20 pairs of beetles. Statistical significance between the mean value of GPCR RNAi versus that of malE control is assessed by one-way ANOVA analysis, followed by Dunnett’s multiple comparisons (***p < 0.001, **p < 0.01, *p < 0.05). malE data were marked as blue bars. (C) The pie chart to show the percentage of RNAi effects on fecundity. (D) The pie chart to show the percentage of RNAi effects on larva hatch rate. (Strong effect p < 0.01, Mild effect p < 0.05, No effect p > 0.05).

