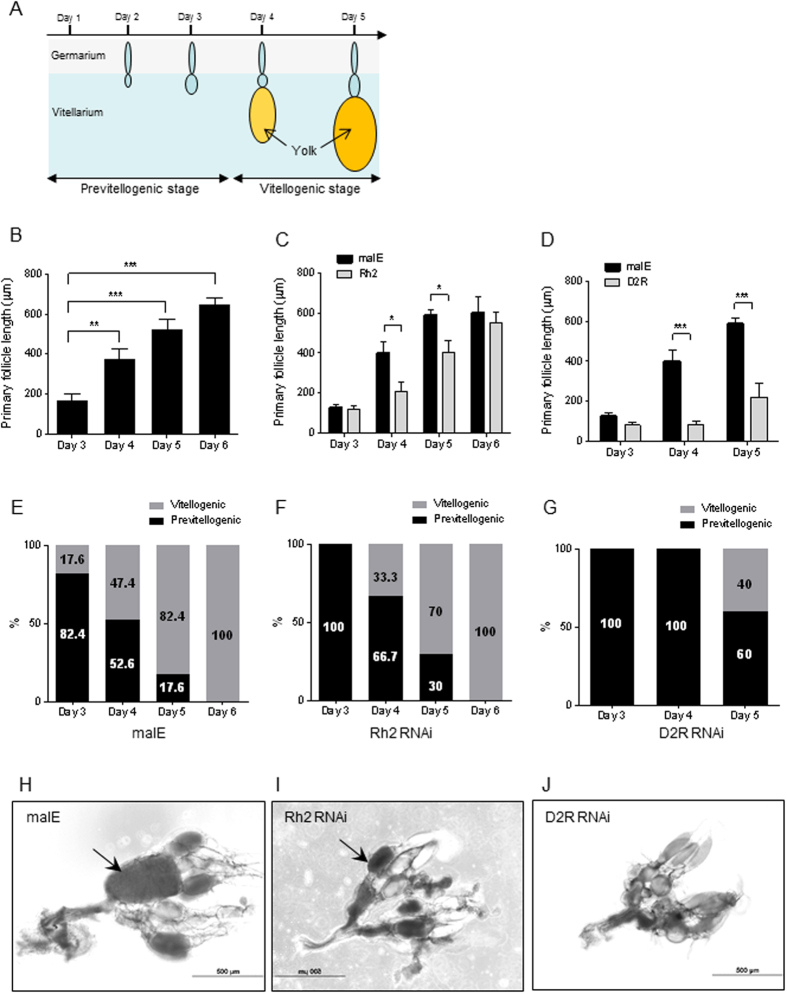
Figure 3. Inhibition of ovarian development in TcD2R RNAi beetles.
(A) Schematic representation to show ovarian growth and two distinct ovarian stages at various ages. (B) Measurement of primary follicle length of ovaries dissected from malE females. (C) Comparison of the primary follicle length between malE and TcRh2 RNAi females. (D) Comparison of the primary follicle length between malE and TcD2R RNAi females. Each bar represents mean ± SE of 7~19 isolated ovaries. Statistical significance is assessed by one-way ANOVA analysis, followed by Dunnett’s multiple comparisons (***p < 0.001, **p < 0.01, *p < 0.05). (E–G) The percentage of two ovarian stages (previtellogenic and vitellogenic) Characterization of the ovarian stage in females injected with dsRNAs for malE, TcRh2 and TcD2R. (H–J) Light microscope images to show the ovaries isolated from females injected with dsRNAs for malE, TcRh2 and TcD2R on day 5 PAE. The dark arrow indicates oocytes that contain yolk and lipid droplets.

