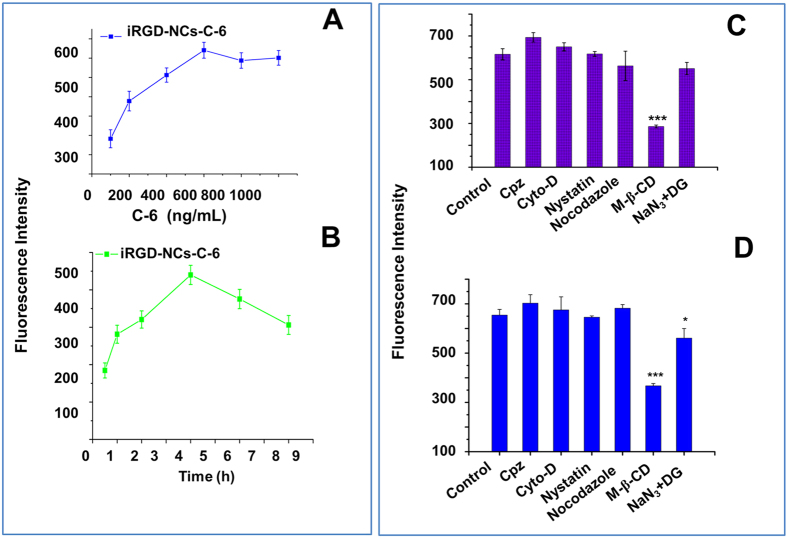
Figure 2. Cellular uptake and internalization mechanism.
(A,B) Intracellular fluorescence intensity of C-6-loaded iRGD-NCs incubated with cells at various concentrations and times. Fluorescence intensity of A549 cells incubated with 400 ng/mL C-6-loaded (C) NCs or (D) iRGD-NCs for 2 h in the presence of various inhibitors, respectively. *p < 0.05, ***p < 0.001 vs control (n = 3).

