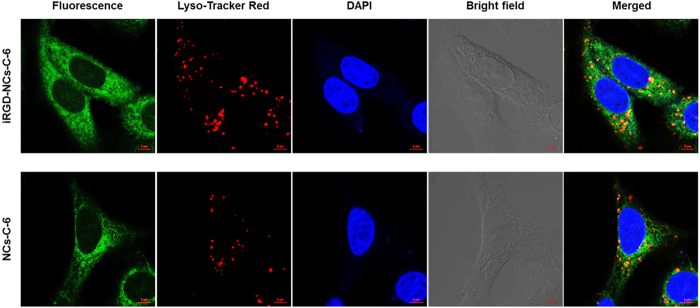
Figure 3. Intracellular distribution and localization of iRGD-NCs-C-6 and NCs-C-6 in A549 cells.
The cells were incubated with 400 ng/mL C-6-loaded iRGD-NCs or NCs for 2 h. The nuclei (blue area) and lysosomes (red area) were stained with DAPI and Lyso-Tracker Red, respectively. The scale bar is 5 μm.

