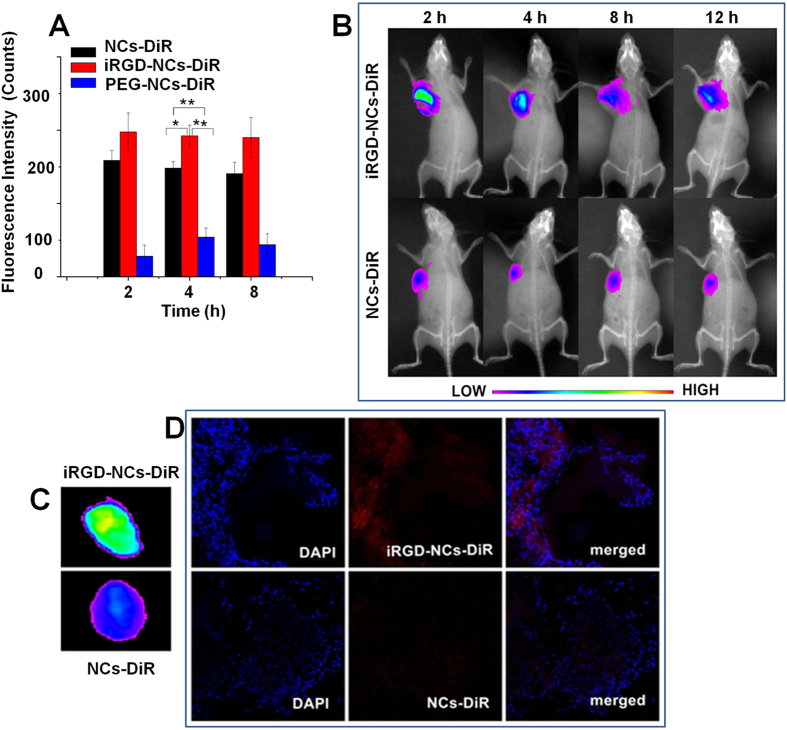
Figure 4. In vivo biodistribution and tumor targeting.
(A) In vivo distribution of DiR-loaded iRGD-NCs, PEG-NCs and NCs in tumor tissue at 2, 4 and 8 h after administration. The fluorescence intensity represents the quantity of iRGD-NCs, PEG-NCs and NCs in the tissues (n = 5). *p < 0.05 and **p < 0.01. (B) In vivo imaging of H22 tumor-bearing mice administered with DiR-loaded iRGD-NCs and NCs at the time points of 2, 4, 8 and 12 h. (C) Ex vivo fluorescence imaging of mouse tumors 12 h after the administration of DiR-loaded iRGD-NCs and NCs. (D) Distribution of DiR-loaded iRGD-NCs and NCs in mouse tumor tissues 12 h post injection. Red: DiR. Blue: cell nuclei.

