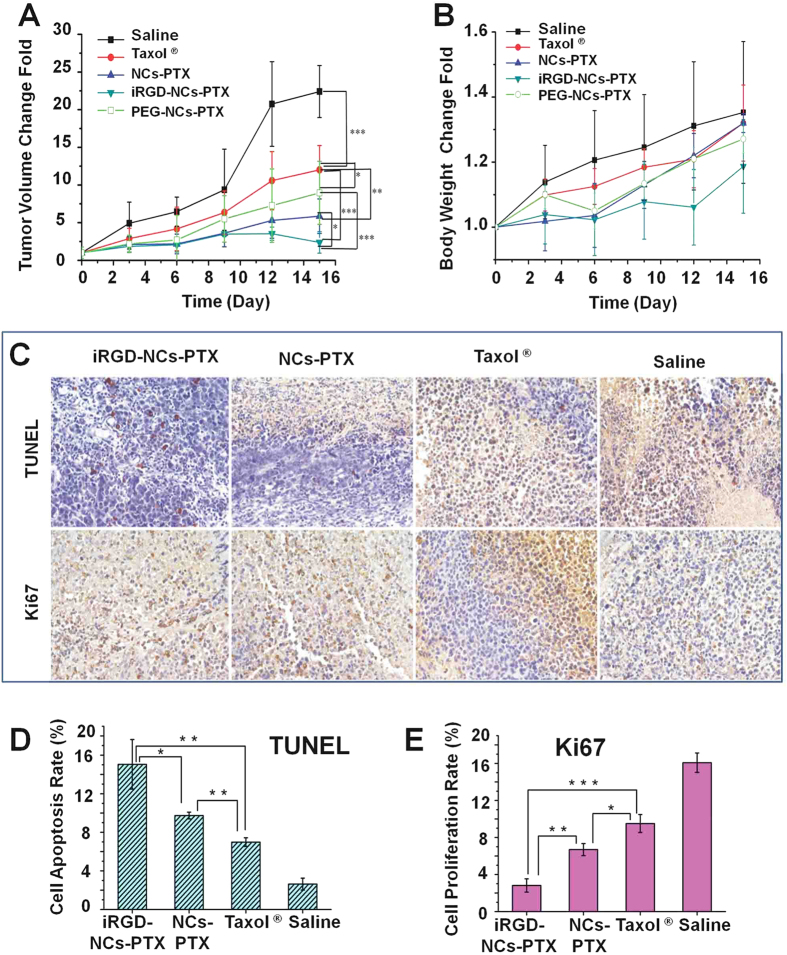
Figure 5. Anti-tumor efficiency.
Anti-tumor activity of PTX formulations in H22 tumor-bearing mice (n = 9), after the mice were administered iRGD-NCs-PTX, PEG-NCs-PTX, NC-PTX, Taxol® at the PTX dose of 10 mg/mL, and saline was used as a control. (A) Time-related tumor volume in H22 tumor-bearing mice. A comparison of tumor volume between the groups was performed on the 15th day. *p < 0.05, **p < 0.01 and ***p < 0.001. (B) Body weight change of the mice after treated with the PTX formulations. (C) TUNEL and Ki67 analysis of tumors. The brown-stained cells represent the positive cells. (D) Quantitative analysis of cell apoptosis (n = 3). *p < 0.05 and **p < 0.01 indicate groups significantly lower than the iRGD-NCs group. (E) Quantitative analysis of cell proliferation (n = 3), *p < 0.05, **p < 0.01 and ***p < 0.001 indicate groups significantly higher than the iRGD-NCs group.

