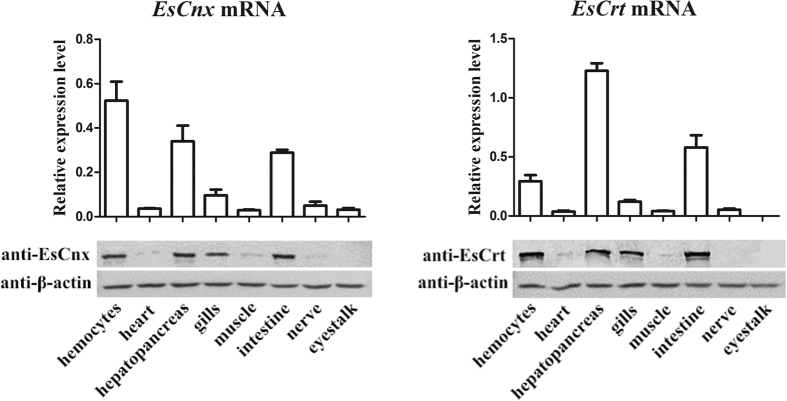
Figure 1. Tissue distributions of EsCnx and EsCrt at the mRNA level (above) revealed by SYBR Green qRT-PCR and protein expression level (below) revealed by western blot.
Vertical bars represent mean ± S.E. (N = 5) for each tissue. Each bar represents the mean value from five determinations with standard error.

