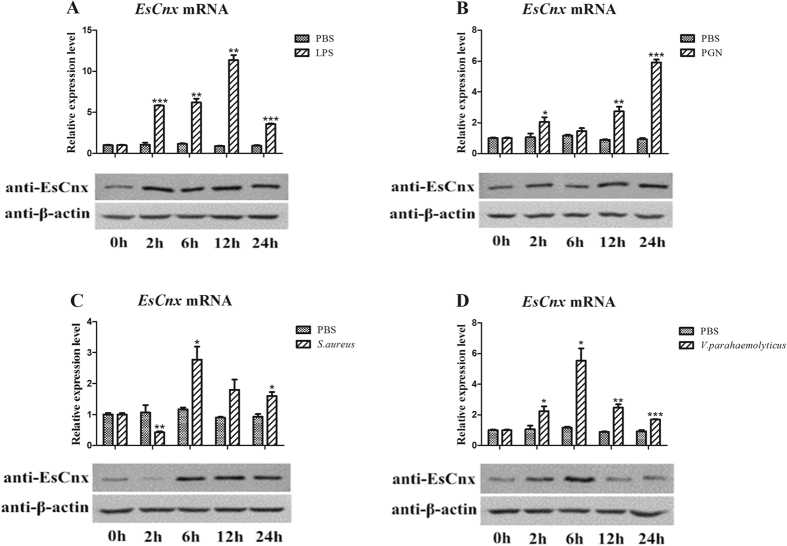
Figure 3.
EsCnx mRNA and protein expression profile in hepatopancreas after LPS (A), PGN (B), S. aureus (C), and V. parahaemolyticus (D) challenge as measured by qRT-PCR and western blot. The GAPDH gene was used as internal control to calibrate the cDNA template of all samples. Vertical bars represent mean ± S.E. (N = 5). Each bar represents the mean value of five determinations with standard deviation. Asterisks indicate significant differences (*P < 0.05, **P < 0.01, ***P < 0.001) compared with the control. The β-actin was used as internal control to calibrate the protein template of all samples.

