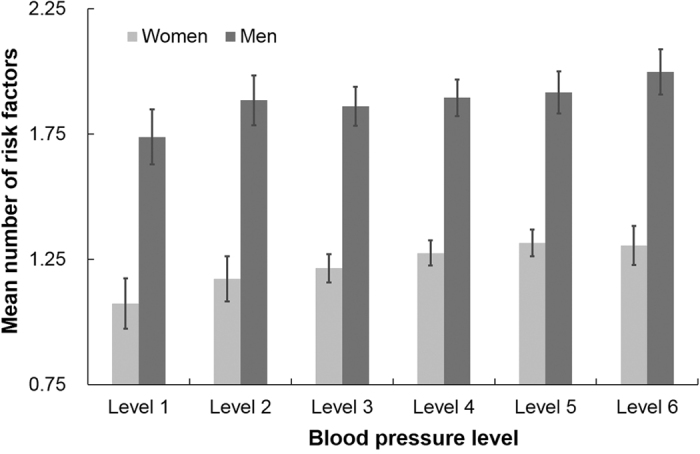
Figure 1. Mean number of risk factors and 95% CI among male and female hypertensive population with different blood pressure level*.

*All analyses were weighted. Bars indicate 95% confidence intervals taking into account complex sample design.

*All analyses were weighted. Bars indicate 95% confidence intervals taking into account complex sample design.