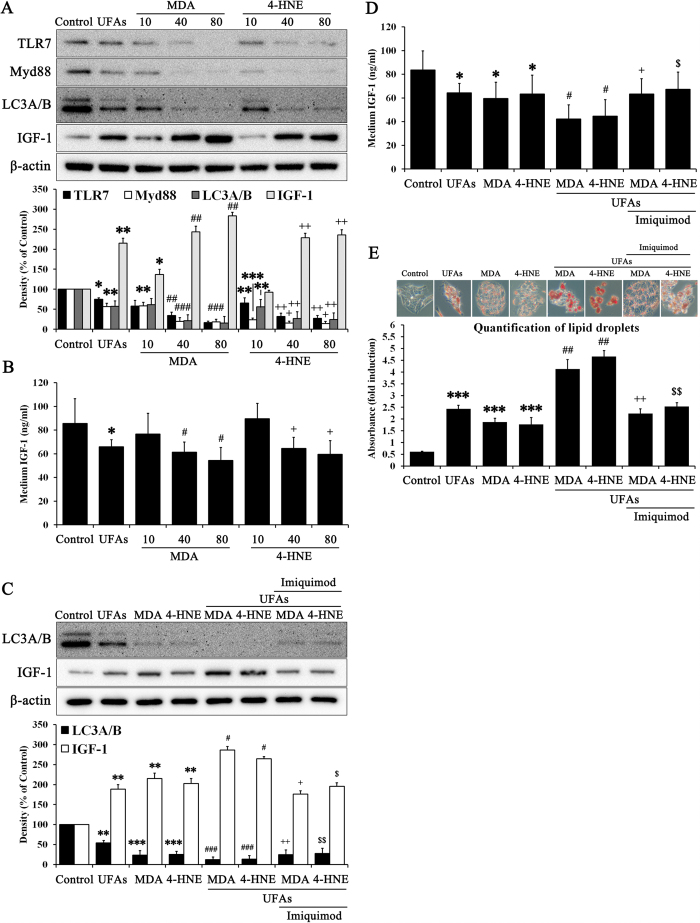
Figure 4. MDA and 4-HNE accelerate massive lipid accumulation by suppressing TLR7.
Hepatocytes were treated with or without 10, 40, and 80 μM MDA and 4-HNE for 72 h. Immunoblotting was performed to evaluate (A) the protein expression of TLR7, Myd88, LC3A/B, IGF-1, and β-actin. (B) Medium from the cell supernatant was used to evaluate IGF-1 contents on ELISA. Data are mean and SEM values (n = 3). *p < 0.05 vs. untreated control. **p < 0.01 vs. untreated control. ***p < 0.001 vs. untreated control. #p < 0.05 vs. MDA 10 group. ##p < 0.01 vs. MDA 10 group. ###p < 0.001 vs. MDA 10 group. +p < 0.05 vs. 4-HNE 10 group. ++p < 0.01 vs. 4-HNE 10 group. Hepatocytes were treated with or without 40 μM MDA, 40 μM 4-HNE, and 10 μg/ml imiquimod in the presence or absence of 10 mM UFAs for 72 h. (C) We then performed immunoblotting to evaluate the protein expression of LC3A/B and IGF-1. (D) Medium from the cell supernatant was used to evaluate IGF-1 content on ELISA. (E) Oil Red O staining was performed to evaluate lipid accumulation. The red stained area indicated lipid droplets, which were quantified by absorbance measurement. Data are mean and SEM values (n = 3). *p < 0.05 vs. untreated control. **p < 0.01 vs. untreated control. ***p < 0.001 vs. untreated control. #p < 0.05 vs. UFAs group. ##p < 0.01 vs. UFAs group. ###p < 0.001 vs. UFAs group. +p < 0.05 vs. MDA + UFAs group. ++p < 0.01 vs. MDA + UFAs group. $p < 0.05 vs. 4-HNE + UFAs group. $$p < 0.01 vs. 4-HNE + UFAs group.

