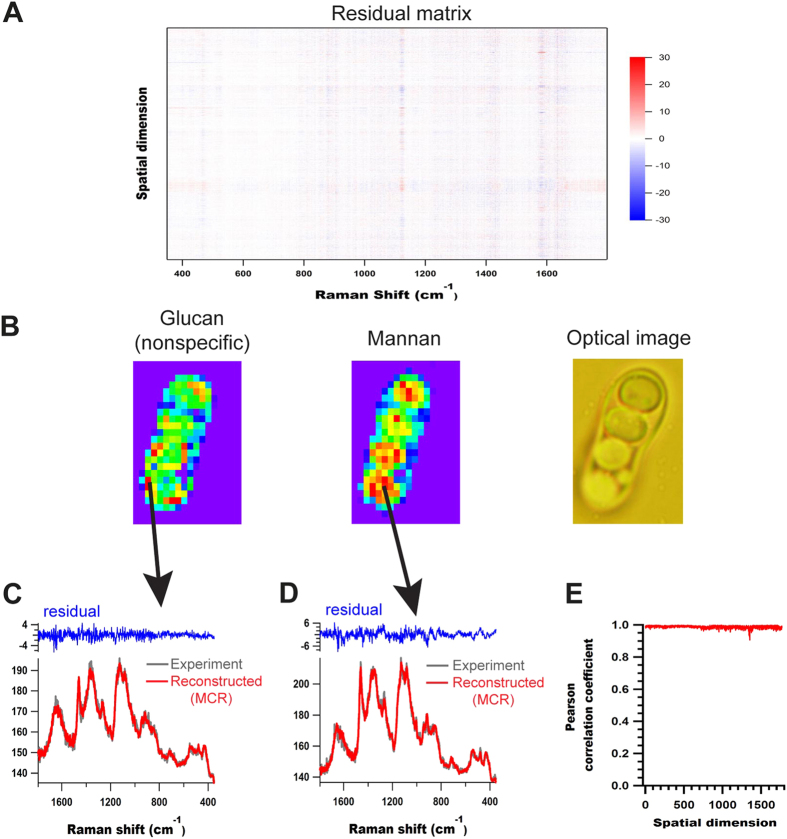
Figure 6. MCR residual analysis.
(A) Residual matrix, (B) Optical image of S. pombe vegetative cell with MCR images from 3rd and 4th components - glucan and mannan respectively- [same as Fig. 5], (C,D) comparison of experimental and MCR reconstructed data along with corresponding residuals from two representative points rich in glucan and mannan respectively, as indicated by black arrows and (E) Pearson correlation coefficients obtained for each point before and after MCR.

