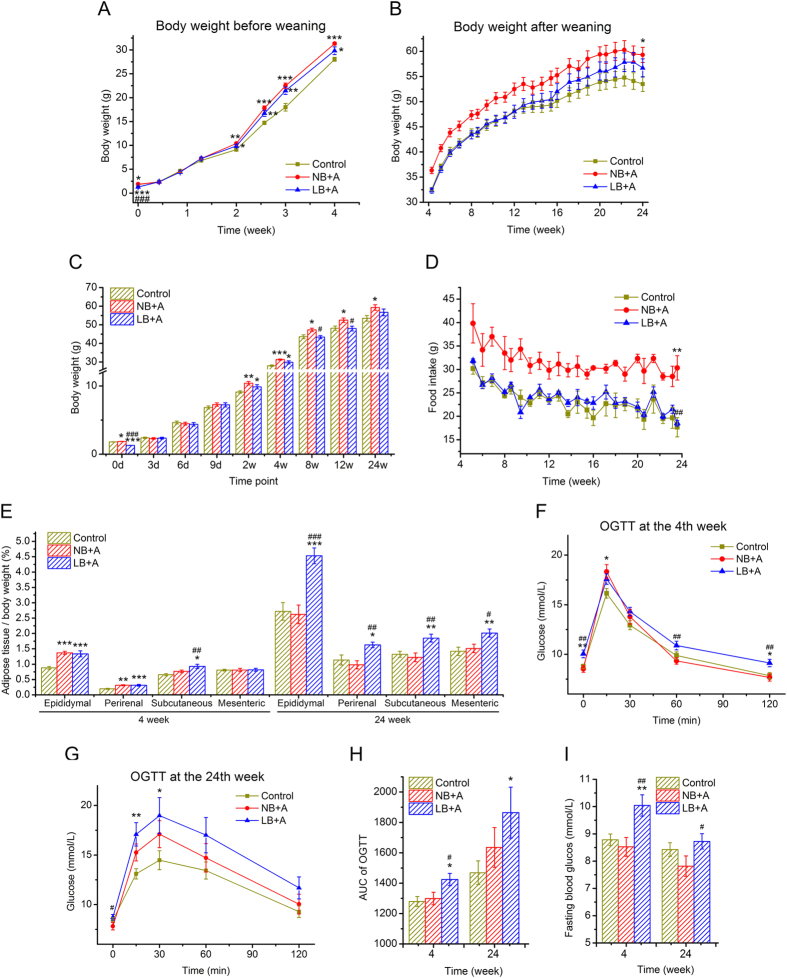
Figure 1. The effects of suckling overfeeding-induced accelerated postnatal growth on the growth and metabolism of low-birth-weight (LB) and normal-birth-weight (NB) mice.
(A) The body weight curve from birth to age 4 weeks (weaning). (B) The body weight curve from age 4.5 weeks to 24 weeks. (C) Body weight at representative time points. d, days; w, weeks. (D) Food intake after weaning at 4 weeks. (E) Adipose pads as a percentage of body weight at 4 and 24 weeks of age. (F) Curve of the Oral Glucose Tolerance Test (OGTT) at 4 weeks of age. (G) Curve of OGTT at 24 weeks. (H) Areas under the curve (AUC) of OGTT at 4 and 24 weeks. (I) Fasting blood glucose at 4 and 24 weeks. Data are shown as the means ± SEM. Differences were assessed by ANOVA. *P < 0.05, **P < 0.01, ***P < 0.001 vs. control group; #P < 0.05, ##P < 0.01, ###P < 0.001 vs. NB + A group. n = 12 per group.

