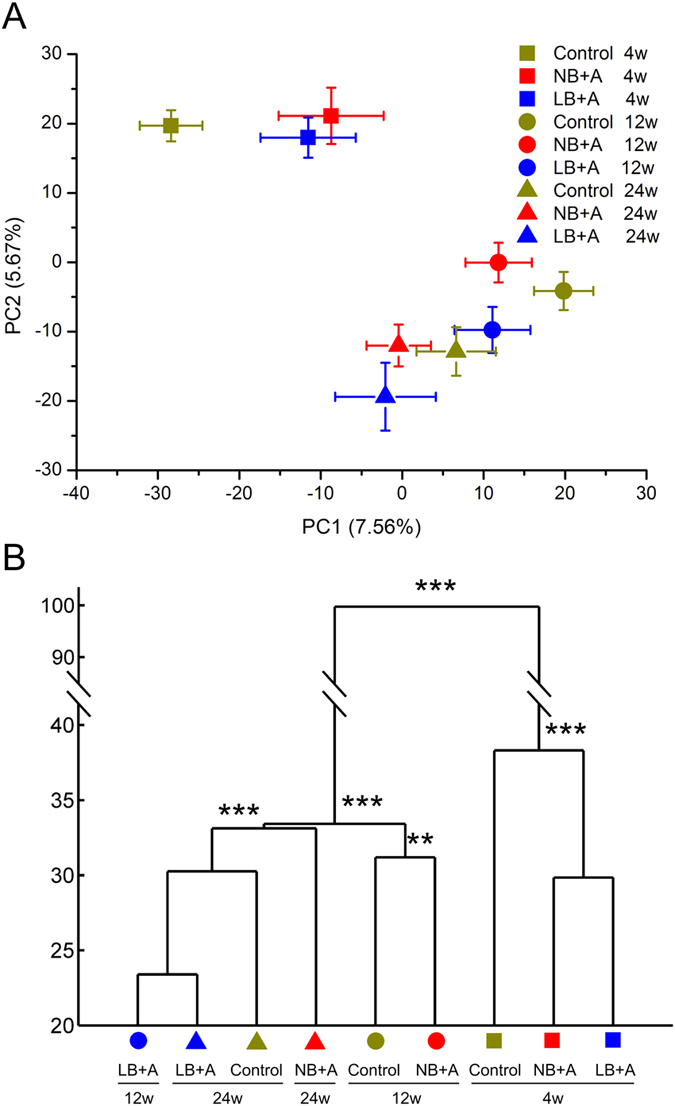
Figure 2. The overall structure of fecal microbiota of LB + A, NB + A and control mice at 4, 12 and 24 weeks of age.

(A) PCA scores plot based on OTU abundance. Each point represents the mean principal coordinate (PC) score of all mice in an animal group at one time point, and the error bar represents the s.e.m. (B) The clustering of gut microbiota of different animal groups calculated with multivariate analysis of variance (MANOVA) test, and *P < 0.05, **P < 0.01, ***P < 0.001. wk, weeks. n = 11 for control group at age 4 and 24 weeks; n = 12 for control group at age 12 weeks and other two group at three time points.
