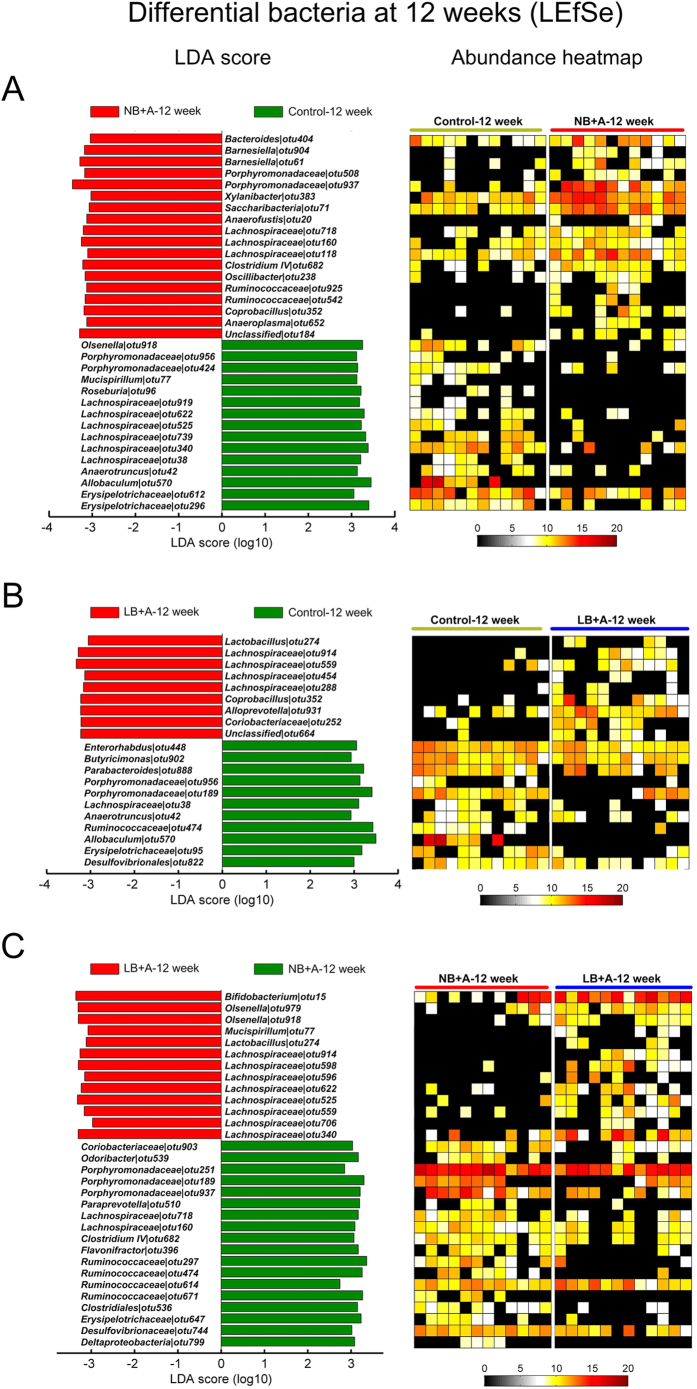
Figure 4. Bacterial phylotypes of which abundances were different between two animal groups among 12-week-old LB + A, NB + A and control mice identified by LEfSe.
(A) NB + A versus control mice. (B) LB + A versus control mice. (C) LB + A versus NB + A mice. The left histogram shows the LDA scores computed for OTUs differentially abundant between two animal groups. The right heat map shows the relative abundance (log 2 transformed) of altered OTUs.

