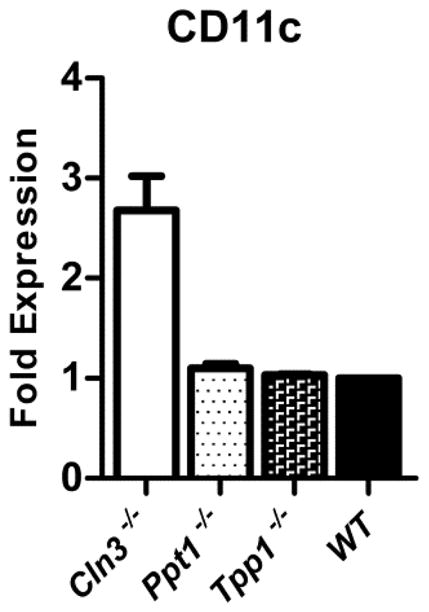
Fig. 4. Comparative study of CD11c surface expression across NCL mouse models assessed with flow cytometry.

Mixed bone marrow cultured cells from wild type mice and three mouse models of neuronal ceroid lipofuscinoses (NCLs) staining negatively for Fixable Viability Dye eFluor 780 were assessed for CD11c surface expression as determined by median fluorescence intensity (MFI) with flow cytometry. Models identified are infantile NCL (Ppt1−/−, n=4), late infantile NCL (Tpp1−/−, n=3), and juvenile NCL (Cln3−/−, n=9). Results are shown as the ratio of CD11c MFI for each mouse model relative to wild type (n=2), set at 1. Columns and bars represent mean ± S.E.M.
