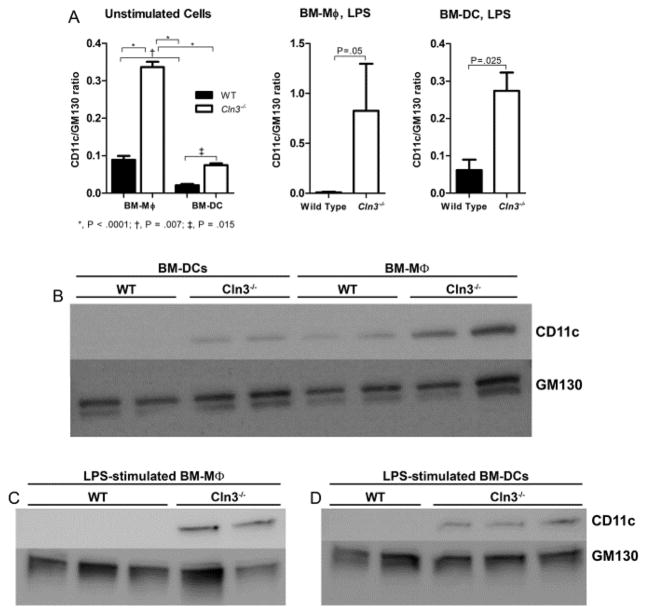
Fig. 5. CD11c total protein levels are significantly elevated in unstimulated and LPS-stimulated Cln3−/− bone marrow macrophages and bone marrow dendritic cells compared to their wild type counterparts.
Total protein levels of CD11c were assessed in Cln3−/− and wild type (WT) bone marrow cultured cells with Western blot. Day 12 bone marrow macrophages (BM-Mφ) and bone marrow dendritic cells (BM-DCs), were harvested, unstimulated or 48 hours after addition of lipopolysaccharide (LPS). Total protein lysate was interrogated for levels of CD11c protein (top band in B, C, and D) with GM130 as the loading control (bottom double band in B, C, and D). Densitometric analysis of CD11c protein expression is shown (A). Band intensities were quantified by densitometry and the ratio of integrated densities of CD11c to GM130 was calculated. Columns and bars represent mean ± S.E.M. For unstimulated samples, statistical significance was determined by 2-way ANOVA with genotype and fraction as factors, with reported P values for post-hoc Fisher’s LSD (n=2, all groups). For LPS-stimulated samples, statistical significance was determined with the one-tailed Student’s t test (n= 3 wild type BM-Mφ; n=2 Cln3−/− BM-Mφ; n=2 wild type BM-DCs; n=3 Cln3−/− BM-DCs). Representative Western blots are shown (B–D).

