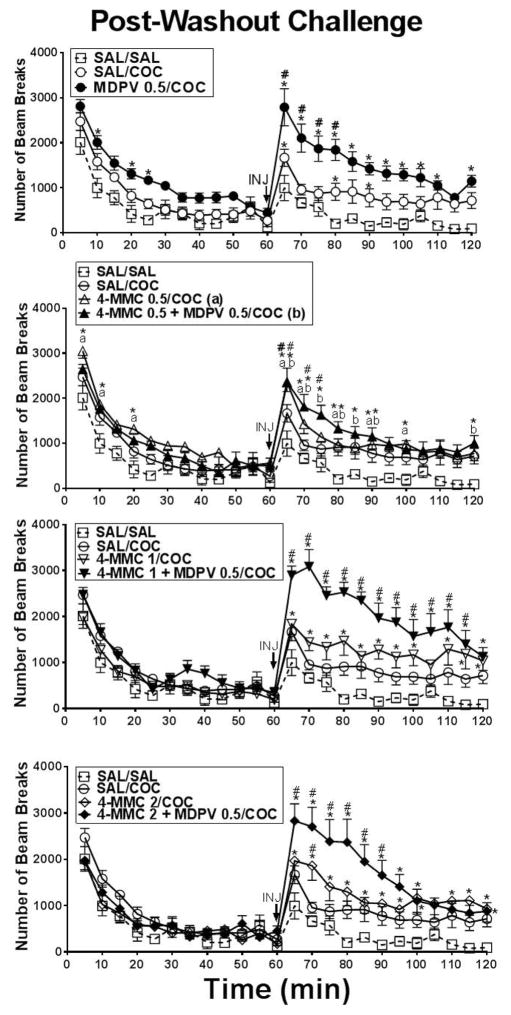
Figure 3.
Time course of horizontal activity plotted in 5 min intervals during the 60 min habituation period and 60 min immediately following 5 mg/kg cocaine or saline challenge after a 10 day washout. Individual points represent group means (±S.E.M.) at each 5 min interval. The SAL/SAL group (n=6) received a saline injection. The SAL/COC (n=10) and other treatment groups (n=8) received 5.0 mg/kg cocaine. The same SAL/SAL and SAL/COC control data are plotted in all four graphs for visual comparison to each treatment group. Symbols indicate statistically significant differences at particular time intervals. Asterisks (*) indicate statistical differences from the SAL/SAL treatment group and pound signs (#) indicate statistical differences (i.e., p < .05) from the SAL/COC treatment group.

