
Fig. 3.
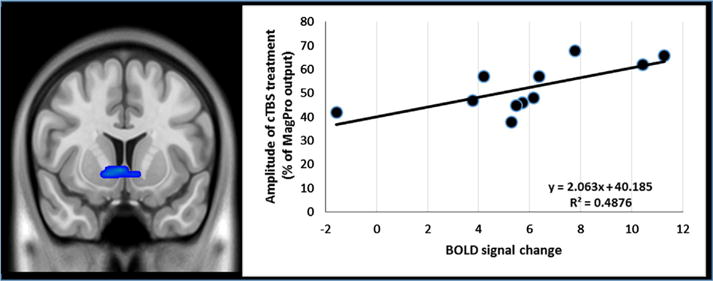
The relationship between change in BOLD signal in the ventral striatum with the amplitude of cTBS treatment. Individual variability in the change in ventral striatum BOLD signal was extracted via the eigenvalues from the functionally defined region of interest (Table 3). This was significantly correlated with the amplitude of the cTBS treatment (110% resting motor threshold) suggesting a dose-response effect on neural circuitry. Individual variability in BOLD signal was not correlated with other drug use variables.