
Fig. 2.
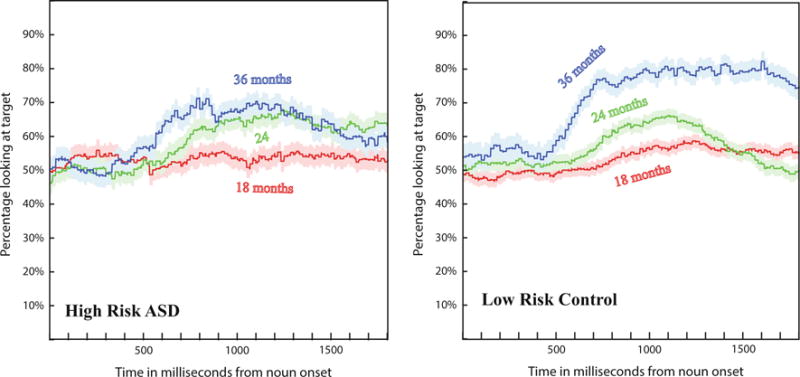
Looks at the target image. The curves represent the percentage of trials in which the children were looking at the target image as opposed to the distractor image plotted as a function of time and starting with the target noun onset. The curves show an effect of age and differences between the two groups: high-risk ASD and low risk control. The shaded regions indicate one standard deviation error bars