Fig. 1.
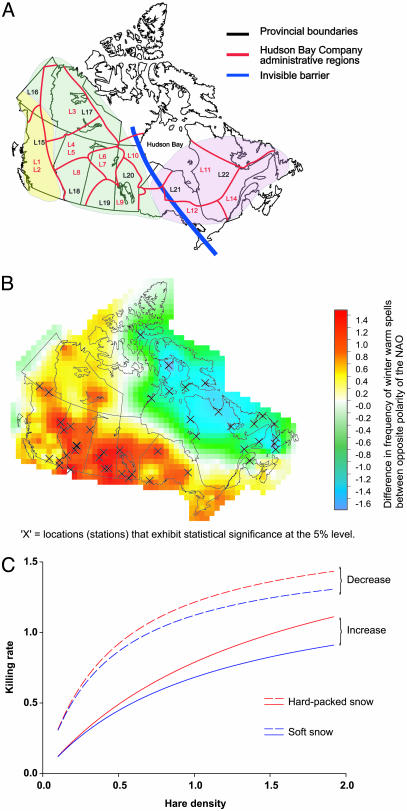
The relation between snow condition and lynx population dynamics and lynx hunting success. (A) The Pacific (yellow), Continental (green), and Atlantic (pink) regions; the old Hudson Bay time series are given as L1–L14 (red) and the modern Statistics Canada time series are given as L15–L22 (green) (1). The thick blue line separating the eastern Atlantic from the central Continental region represents the previously hypothesized [first on the basis of statistical modeling of time-series data on lynx (1) and later on the basis of genetic analyses (2)] invisible barrier. (B) Composite difference in the frequency of winter warm spells between the positive and negative polarity of the NAO during winter. A warm spell is defined as the persistence of the daily maximum temperature above the 80th percentile for at least 3 consecutive days. The NAO index is taken as the time series of the leading empirical orthogonal function of the Northern Hemisphere sea level pressure for the December-to-March period between 20–80°N, 90°Wto 40°E (www.cgd.ucar.edu/∼jhurrell/nao.html). Positive polarity of the NAO leads to lower frequency of warm spells in the Atlantic region and more frequent warm spells in the Continental region. Positive polarity occurs when there is anomalously low sea level pressure throughout the North Atlantic and higher than normal sea level pressure south of 55°N. Statistical significance is determined by a Monte Carlo technique in which the sample is shuffled 1,000 times. (C) The functional response curve (describing lynx hunting success under different conditions of hare abundance) including the phase and snow sinking depth (adjusted R2 = 95%); kill rate, or hunting success, is given as number of killed hares per predator per day, and hare density is given as number of hares per hectare.

