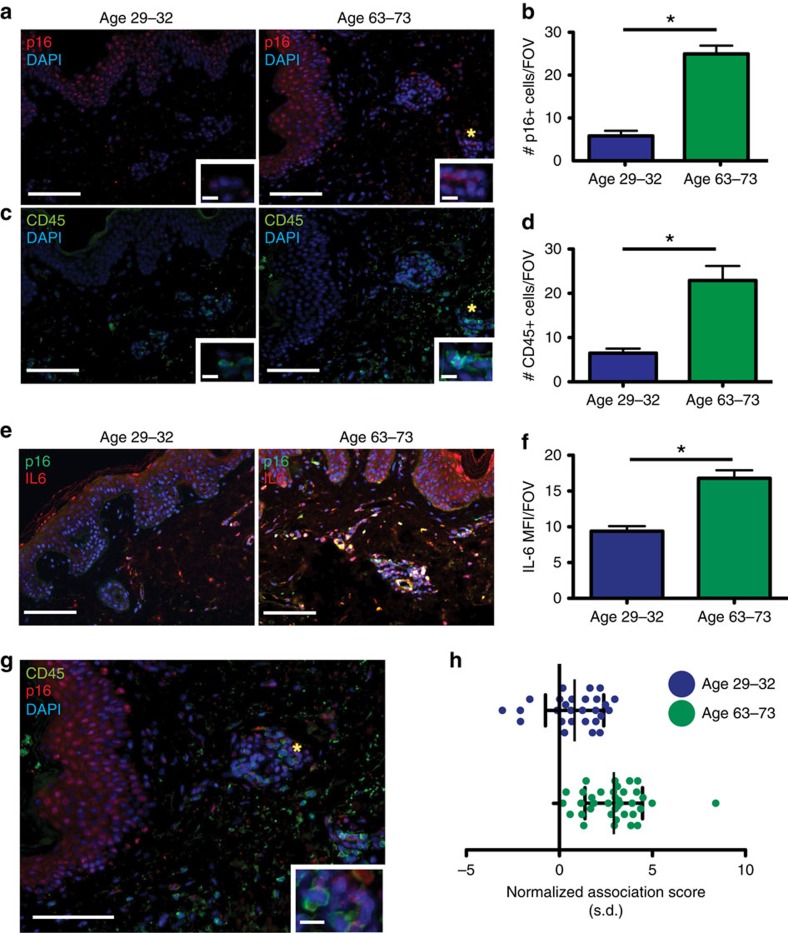
Figure 9. Increases in senescent stromal cells in aged human skin correlate with increases in inflammation.
(a) IF staining for p16INK4a (red) in human skin samples grouped by age. Nuclei are DAPI-stained (blue). Scale bar, 100 or 10 μm in zoomed inset image. *site of zoomed image. (b) Quantification of p16INK4a (red) staining shown in a. grouped by age. *P value <0.05, Student's t-test. Data are mean+s.e.m. Graph contains data from four donors per age group, multiple images (5–17) per donor. (c) IF staining for CD45 (green) in human skin samples grouped by age. Nuclei are DAPI-stained (blue). Scale bar, 100 or 10 μm in zoomed inset image. *site of zoomed image. (d) Quantification of CD45 (green) staining shown in c. grouped by age. *P value <0.05, Student's t-test. Data are mean+s.e.m. Graph contains data from four donors per age group, multiple images (5–17) per patient. (e) IF staining for p16INK4A (p16, green) and IL-6 (red) on human skin. Nuclei are DAPI-stained (blue). Secondary alone control showed no detectable staining (data not shown). Double-positive staining (yellow) was noted in older individuals (Age 63–73). Scale bar, 100 μm. (f) Quantification of IL-6 IF staining shown in e. Data are the MFI+s.e.m. per × 20 FOV. *P value <0.05, Student's t-test. Four donors per age group, multiple images (4–10) per donor were analysed. (g) IF co-staining for p16INK4a (red) and CD45 (green) in human skin. Nuclei are DAPI-stained (blue). Panel e is the merged image of the staining shown in a,c. Scale bar, 100 or 10 μm in zoomed inset image. *site of zoomed image. (h) Images from staining shown in e were analysed using the same spatial statistics described in Fig. 1g. In samples from donors aged 63–73, a strong association of p16+ and CD45+ cells was observed (mean normalization score 2.9, 95% CI 2.4–3.4). Samples from donors aged 29–32 show weak association (mean normalization score 0.8, 95% CI 0.2–1.4). 4 patients per age group. Error bars are s.d. n=27–37. FOV, field of view.

