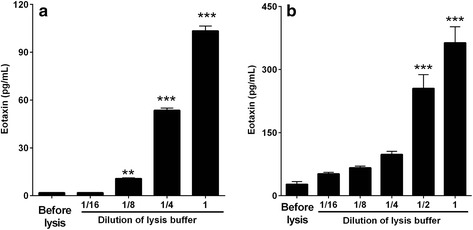
Fig. 5.

Levels of eotaxin in alveolar macrophages or normal lung tissue before/after incubation with lysis buffer. Alveolar macrophages and normal lung tissue were incubated with different dilutions of cell lysis buffer at 1 × 10⁷ cells/mL for alveolar macrophages and 50 mg/mL for normal lung tissue, and the levels of eotaxin in the supernatants were measured. Lysis of (a) alveolar macrophages and (b) normal lung tissue with undiluted cell lysis buffer showed massive increases in the levels of eotaxin and serial dilution of lysis buffer showed a good dose–response. While samples before the addition of cell lysis buffer showed minimal levels of eotaxin. Mean ± SEM (n = 4). One-way ANOVA test was applied for comparison of treated groups against control (samples before lysis) with statistical significance indicated by ** p < 0.01 and *** p < 0.001
