Fig. 2.

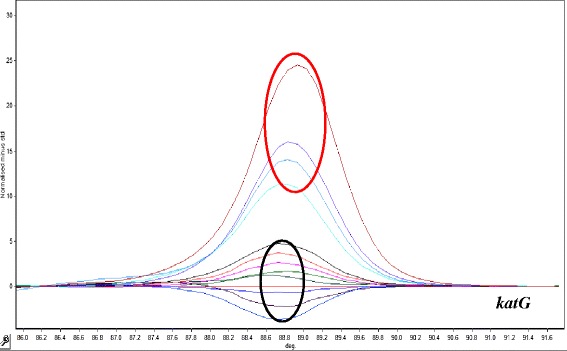
HRM curve analysis for resistant discrimination in 235 pb amplified fragment from katG gene. Resistant profiles are show in red circle (four samples). Sensitive profiles are show in black circle (eight samples)

HRM curve analysis for resistant discrimination in 235 pb amplified fragment from katG gene. Resistant profiles are show in red circle (four samples). Sensitive profiles are show in black circle (eight samples)