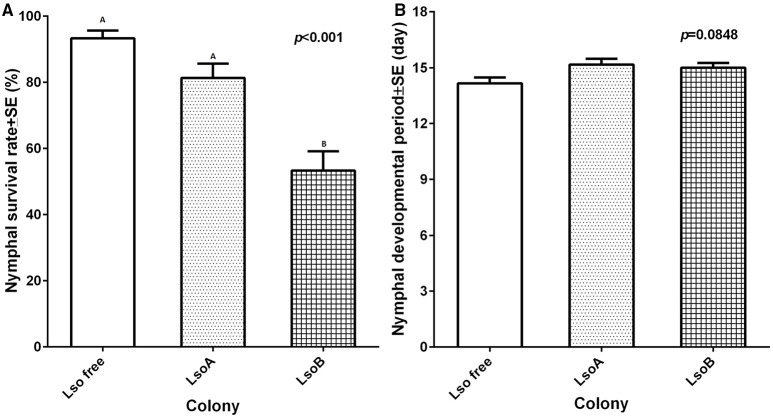
Figure 3.
Nymphal survival percentage and average immature developmental time of each colony. (A) The percentage of nymphal survival was calculated as the number of emerged adults out of the total number of hatched eggs. Each bar represents the mean and standard error of nymphal survival percentage of n = 6 experimental replicates. Letters indicate statistical differences between insect classes at p ≤ 0.05 using LSD t-test. (B) Immature potato psyllid development time was measured as the time between the appearance of first instar and first adult emergence. Each bar represents the mean and standard error of the immature development period in days of n = 6 experimental replicates [F(2, 15) = 3.37, p = 0.0619].

