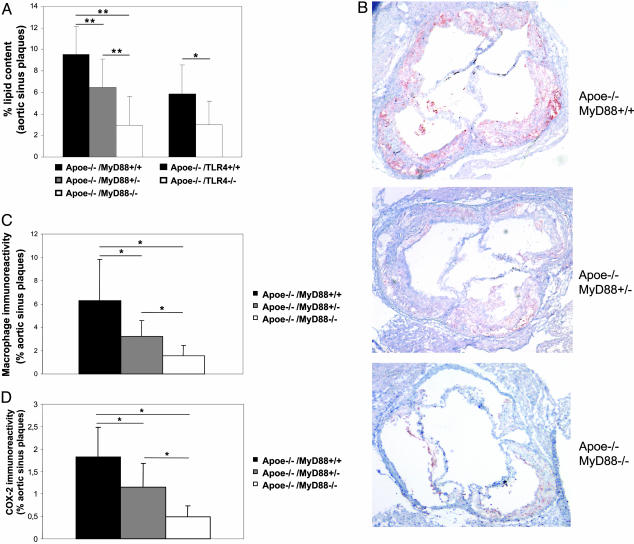
Fig. 2.
Lipid content, macrophage infiltration, and COX-2 expression in aortic sinus plaques is reduced in Apoe–/–/MyD88–/– mice. (A) Quantification of the lipid content in aortic plaques from Apoe–/–/MyD88–/–, Apoe–/–/MyD88+/–, and Apoe–/–/MyD88+/+ (Left) and Apoe–/–/TLR4–/– and Apoe–/–/TLR4+/+ (Right) mice. Shown are means and SD of the percentage of lipid content relative to total plaque areas (n = 10 for Apoe–/–/MyD88–/–, Apoe–/–/MyD88+/–, and Apoe–/–/MyD88+/+; n = 7 for Apoe–/–/TLR4+/+; and n = 8 for Apoe–/–/TLR4–/–). Relative lipid content in Apoe–/–/MyD88–/– or Apoe–/–/TLR4–/– is significantly reduced compared with corresponding wild-type mice (**, P < 0.01; *, P < 0.05). (B) Representative MOMA-2 staining of aortic sinus plaques from Apoe–/–/MyD88–/–, Apoe–/–/MyD88+/–, and Apoe–/–/MyD88+/+ mice. (C) Quantitative analysis of macrophage immunoreactivity in aortic sinus plaques of Apoe–/–/MyD88–/–, Apoe–/–/MyD88+/–, and Apoe–/–/MyD88+/+ mice, expressed as a proportion of the total plaque areas (n = 10 in each group). Means and SD are shown (*, P < 0.01). (D) Quantitative analysis of COX-2 immunofluorescent staining in sclerotic plaques of Apoe–/–/MyD88–/–, Apoe–/–/MyD88+/–, and Apoe–/–/MyD88+/+ mice (n = 7 in each group). Means and SD are shown (*, P < 0.01).

